
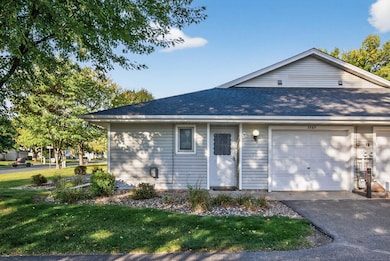
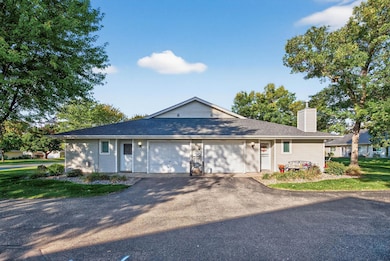
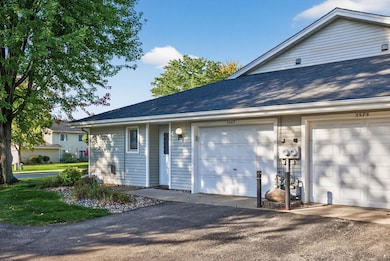
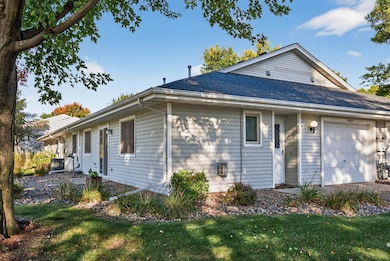
3567 156th St W Rosemount, MN 55068
Estimated payment $1,605/month
Highlights
- 1 Car Attached Garage
- Living Room
- 1-Story Property
- Rosemount Middle School Rated A-
- No Interior Steps
- Forced Air Heating and Cooling System
About This Home
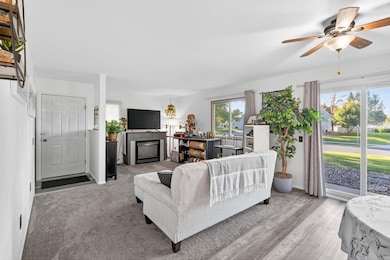
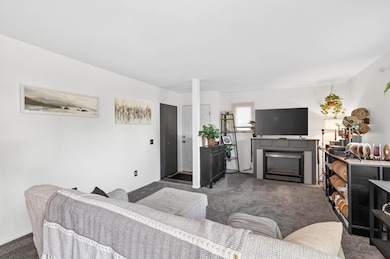
Great opportunity to enjoy one level living in a great Rosemount location where all the updating has already been done for you! Cozy yet functional in every way, this home offers a living room with gas fireplace, an updated & efficient kitchen with white cabinets, elegant countertops and backsplash. Updated flooring throughout including luxury vinyl plank in just about everywhere! Fresh neutral paint, white baseboard and trim and knock-down ceilings! Very spacious primary bedroom and a large walk-in closet as well as a second bedroom, all on the same level.
Townhouse Details
Home Type
- Townhome
Est. Annual Taxes
- $1,744
Year Built
- Built in 1985
Lot Details
- 5,097 Sq Ft Lot
- Lot Dimensions are 70x67
HOA Fees
- $325 Monthly HOA Fees
Parking
- 1 Car Attached Garage
Home Design
- Vinyl Siding
Interior Spaces
- 1,002 Sq Ft Home
- 1-Story Property
- Gas Fireplace
- Living Room
- Dining Room
- Basement
Kitchen
- Range
- Microwave
- Dishwasher
- Disposal
Bedrooms and Bathrooms
- 2 Bedrooms
- 1 Bathroom
Laundry
- Dryer
- Washer
Additional Features
- No Interior Steps
- Forced Air Heating and Cooling System
Community Details
- Association fees include hazard insurance, lawn care, ground maintenance, professional mgmt, trash, snow removal
- Rowcal Association, Phone Number (651) 233-1307
- Valley Oak Add Rep Subdivision
Listing and Financial Details
- Assessor Parcel Number 348131006050
Map
Home Values in the Area
Average Home Value in this Area
Tax History
| Year | Tax Paid | Tax Assessment Tax Assessment Total Assessment is a certain percentage of the fair market value that is determined by local assessors to be the total taxable value of land and additions on the property. | Land | Improvement |
|---|---|---|---|---|
| 2024 | $1,744 | $187,000 | $30,800 | $156,200 |
| 2023 | $1,744 | $175,900 | $30,700 | $145,200 |
| 2022 | $1,450 | $175,500 | $30,500 | $145,000 |
| 2021 | $1,474 | $145,200 | $26,600 | $118,600 |
| 2020 | $1,458 | $144,300 | $25,300 | $119,000 |
| 2019 | $1,196 | $138,200 | $24,100 | $114,100 |
| 2018 | $1,154 | $123,500 | $22,500 | $101,000 |
| 2017 | $1,103 | $117,000 | $21,400 | $95,600 |
| 2016 | $982 | $109,300 | $20,800 | $88,500 |
| 2015 | $908 | $70,670 | $14,277 | $56,393 |
| 2014 | -- | $64,893 | $13,020 | $51,873 |
| 2013 | -- | $50,505 | $10,415 | $40,090 |
Property History
| Date | Event | Price | List to Sale | Price per Sq Ft |
|---|---|---|---|---|
| 10/30/2025 10/30/25 | Price Changed | $214,990 | -2.3% | $215 / Sq Ft |
| 10/21/2025 10/21/25 | Price Changed | $220,000 | -2.2% | $220 / Sq Ft |
| 10/08/2025 10/08/25 | For Sale | $225,000 | -- | $225 / Sq Ft |
Purchase History
| Date | Type | Sale Price | Title Company |
|---|---|---|---|
| Warranty Deed | $167,000 | Vlking Title Llc | |
| Warranty Deed | $123,000 | Bankers Title | |
| Warranty Deed | $74,000 | None Available |
Mortgage History
| Date | Status | Loan Amount | Loan Type |
|---|---|---|---|
| Open | $149,000 | New Conventional | |
| Previous Owner | $98,650 | VA | |
| Previous Owner | $75,550 | VA |
Source: NorthstarMLS
MLS Number: 6801713
APN: 34-81310-06-050
Disclaimer: Certain information contained herein is derived from information provided by parties other than Homes.com. All information provided is deemed reliable, but is not guaranteed to be accurate and should be independently verified.
![]() Based on information submitted to the MLS GRID. All data is obtained from various sources and may not have been verified by broker or MLS GRID. Supplied Open House Information is subject to change without notice. All information should be independently reviewed and verified for accuracy. Properties may or may not be listed by the office/agent presenting the information. Some IDX listings have been excluded from this website.
Based on information submitted to the MLS GRID. All data is obtained from various sources and may not have been verified by broker or MLS GRID. Supplied Open House Information is subject to change without notice. All information should be independently reviewed and verified for accuracy. Properties may or may not be listed by the office/agent presenting the information. Some IDX listings have been excluded from this website.
The Digital Millennium Copyright Act of 1998, 17 U.S.C. § 512 (the “DMCA”) provides recourse for copyright owners who believe that material appearing on the Internet infringes their rights under U.S. copyright law. If you believe in good faith that any content or material made available in connection with our website or services infringes your copyright, you (or your agent) may send us a notice requesting that the content or material be removed, or access to it blocked.
Notices must be sent in writing by email to DMCAnotice@MLSGrid.com.
The DMCA requires that your notice of alleged copyright infringement include the following information:
(1) description of the copyrighted work that is the subject of claimed infringement;
(2) description of the alleged infringing content and information sufficient to permit us to locate the content;
(3) contact information for you, including your address, telephone number and email address;
(4) a statement by you that you have a good faith belief that the content in the manner complained of is not authorized by the copyright owner, or its agent, or by the operation of any law;
(5) a statement by you, signed under penalty of perjury, that the information in the notification is accurate and that you have the authority to enforce the copyrights that are claimed to be infringed; and
(6) a physical or electronic signature of the copyright owner or a person authorized to act on the copyright owner’s behalf. Failure to include all of the above information may result in the delay of the processing of your complaint.
- 3615 156th St W
- 3610 156th St W
- 15400 Chippendale Ave W Unit 315
- 15552 Cherry Path
- 15245 Carrousel Way
- 15109 Cimarron Way
- 4037 156th St W
- 15157 Crestone Cir
- 3388 Upper 149th St W
- 15068 Derby Cir
- 14896 Cimarron Ave W
- 14914 Covington Ave
- 4174 158th St W
- Bristol Plan at Amber Fields - Landmark Collection
- Itasca Plan at Amber Fields - Landmark Collection
- Lewis Plan at Amber Fields - Landmark Collection
- 1065 Achilles Dr
- Sinclair Plan at Amber Fields - Landmark Collection
- Washburn Plan at Amber Fields - Landmark Collection
- 15008 December Way
- 14595-14599 Cimarron Ave
- 3830 144th St W
- 14589 S Robert Trail
- 2930 146th St W
- 2978 145th St W Unit 4
- 2800 145th St W
- 15622 Echo Ridge Rd
- 5181 161st St
- 5076 161st St W
- 15899 Elmhurst Ln
- 5161 148th St W
- 13940 Bundoran Ave Unit 134
- 2894 138th St W Unit 48
- 14249 Banyan Ln
- 14769 Endicott Way
- 17082 Dysart Place
- 14964 Avondale View
- 14260 Empire Ave
- 17119 Eastwood Ave
- 5520 W 142nd St W
