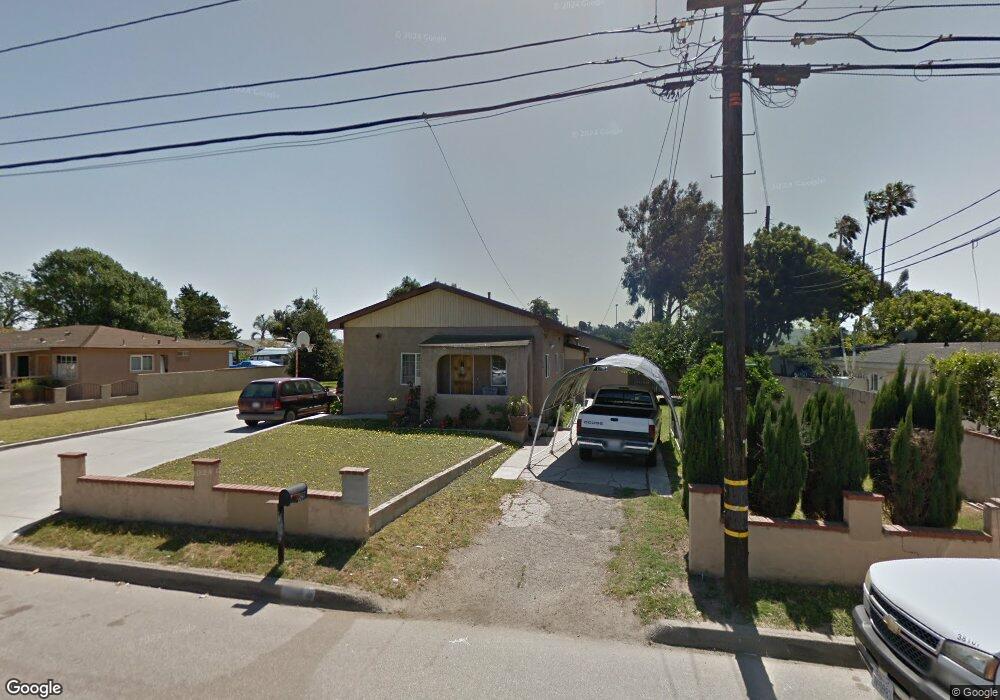
3568 Almond Dr Oxnard, CA 93036
Nyeland Acres NeighborhoodEstimated Value: $699,000 - $897,146
4
Beds
3
Baths
2,184
Sq Ft
$358/Sq Ft
Est. Value
About This Home
This home is located at 3568 Almond Dr, Oxnard, CA 93036 and is currently estimated at $782,537, approximately $358 per square foot. 3568 Almond Dr is a home located in Ventura County with nearby schools including Rio Real Elementary School, Rio Del Valle Middle School, and Rio Mesa High School.
Ownership History
Date
Name
Owned For
Owner Type
Purchase Details
Closed on
Jan 12, 2021
Sold by
Barajas Salvador P
Bought by
Barajas Salvador P and Preciado Bertha A
Current Estimated Value
Purchase Details
Closed on
Dec 10, 2002
Sold by
Alvarez Bertha
Bought by
Barajas Salvador P
Home Financials for this Owner
Home Financials are based on the most recent Mortgage that was taken out on this home.
Original Mortgage
$30,000
Interest Rate
6.03%
Mortgage Type
Credit Line Revolving
Purchase Details
Closed on
Dec 26, 1996
Sold by
Alvarez Trinidad and Alvarez Maria A
Bought by
Barajas Salvador P
Home Financials for this Owner
Home Financials are based on the most recent Mortgage that was taken out on this home.
Original Mortgage
$180,000
Interest Rate
7.53%
Mortgage Type
Purchase Money Mortgage
Purchase Details
Closed on
Jun 25, 1994
Sold by
Alvarez Trinidad and Alvarez Maria A
Bought by
Barajas Salvador P
Create a Home Valuation Report for This Property
The Home Valuation Report is an in-depth analysis detailing your home's value as well as a comparison with similar homes in the area
Home Values in the Area
Average Home Value in this Area
Purchase History
| Date | Buyer | Sale Price | Title Company |
|---|---|---|---|
| Barajas Salvador P | -- | None Listed On Document | |
| Barajas Salvador P | -- | American Title Co | |
| Barajas Salvador P | $135,000 | Chicago Title Co | |
| Barajas Salvador P | -- | -- |
Source: Public Records
Mortgage History
| Date | Status | Borrower | Loan Amount |
|---|---|---|---|
| Previous Owner | Barajas Salvador P | $30,000 | |
| Previous Owner | Barajas Salvador P | $180,000 |
Source: Public Records
Tax History
| Year | Tax Paid | Tax Assessment Tax Assessment Total Assessment is a certain percentage of the fair market value that is determined by local assessors to be the total taxable value of land and additions on the property. | Land | Improvement |
|---|---|---|---|---|
| 2025 | $4,402 | $277,094 | $151,750 | $125,344 |
| 2024 | $4,402 | $271,661 | $148,774 | $122,887 |
| 2023 | $4,294 | $266,335 | $145,857 | $120,478 |
| 2022 | $4,414 | $261,113 | $142,997 | $118,116 |
| 2021 | $4,375 | $255,994 | $140,194 | $115,800 |
| 2020 | $4,300 | $253,370 | $138,757 | $114,613 |
| 2019 | $4,185 | $248,403 | $136,037 | $112,366 |
| 2018 | $4,047 | $243,533 | $133,370 | $110,163 |
| 2017 | $3,854 | $238,758 | $130,755 | $108,003 |
| 2016 | $3,691 | $234,078 | $128,192 | $105,886 |
| 2015 | $3,428 | $230,564 | $126,267 | $104,297 |
| 2014 | $3,334 | $226,050 | $123,795 | $102,255 |
Source: Public Records
Map
Nearby Homes
- 1050 Avenida Classica
- 902 Paseo Brisas Lindas
- 4388 Central Ave Unit 63
- 4388 Central Ave Unit 133
- 4388 Central Ave Unit 87
- 2007 Inez Dr
- 1902 Ribera Dr Unit 86
- 1250 Crestview Ave
- 0 Alvarado St
- 1842 Sonata Dr
- 2005 San Jose St
- 1069 Corte Barroso
- 2701 Alvarado St
- 5848 Santa Clara Ave
- 2250 Mono St
- 1623 Lola Way
- 1009 Corte Barroso
- 211 Featherstone St
- 565 Rosalinda Dr
- 2850 Wagon Wheel Rd Unit 402
- 3592 Almond Dr
- 3542 Almond Dr
- 3544 Almond Dr
- 3567 Almond Dr
- 3602 Almond Dr
- 3601 Almond Dr
- 3618 Almond Dr
- 3535 Almond Dr
- 3516 Almond Dr
- 3615 Almond Dr Unit 2
- 3615 Almond Dr
- 3668 Almond Dr
- 3636 Almond Dr
- 3565 Almond Dr
- 3652 Almond Dr
- 3517 Almond Dr
- 3635 Almond Dr
- 3462 Almond Dr
- 3481 Almond Dr
- 3662 Almond Dr
Your Personal Tour Guide
Ask me questions while you tour the home.