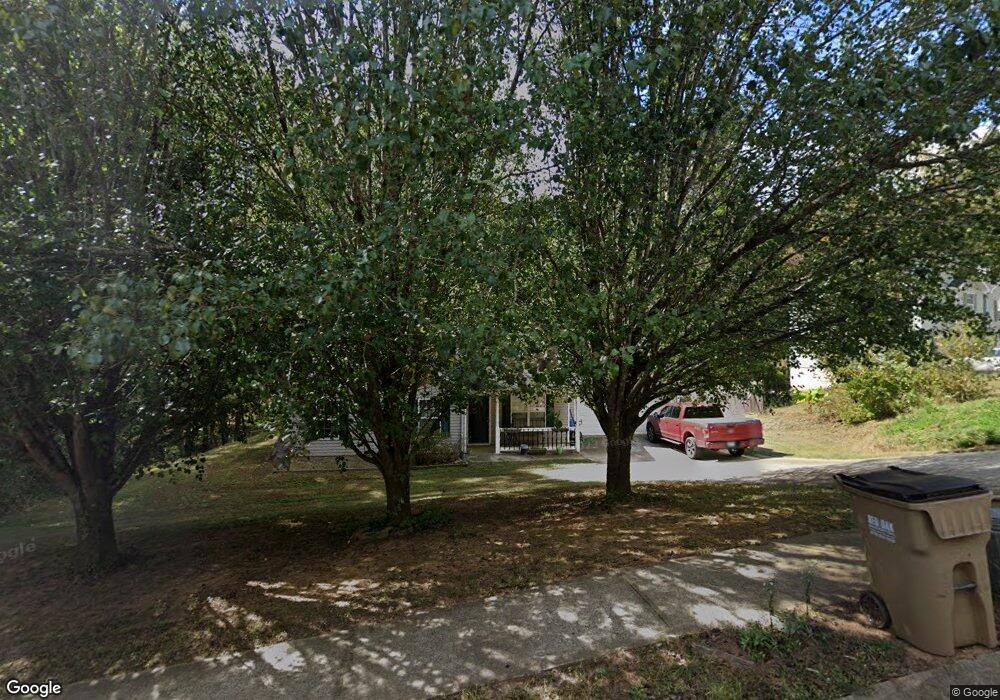
3569 Southchase Dr Gainesville, GA 30507
Southeast Gainesville NeighborhoodEstimated Value: $325,000 - $354,000
3
Beds
2
Baths
1,357
Sq Ft
$252/Sq Ft
Est. Value
About This Home
This home is located at 3569 Southchase Dr, Gainesville, GA 30507 and is currently estimated at $341,434, approximately $251 per square foot. 3569 Southchase Dr is a home located in Hall County with nearby schools including Myers Elementary School, South Hall Middle School, and Johnson High School.
Ownership History
Date
Name
Owned For
Owner Type
Purchase Details
Closed on
Aug 26, 2009
Sold by
Cheek Matthew T
Bought by
Murphy Lydia R
Current Estimated Value
Home Financials for this Owner
Home Financials are based on the most recent Mortgage that was taken out on this home.
Original Mortgage
$117,296
Outstanding Balance
$75,458
Interest Rate
5.11%
Mortgage Type
New Conventional
Estimated Equity
$265,976
Purchase Details
Closed on
Dec 19, 2003
Sold by
Southchase Properties Inc
Bought by
Cheek Matthew T
Home Financials for this Owner
Home Financials are based on the most recent Mortgage that was taken out on this home.
Original Mortgage
$113,400
Interest Rate
5.97%
Mortgage Type
New Conventional
Purchase Details
Closed on
Nov 17, 2003
Sold by
Silveroak Properties Inc
Bought by
Southchase Properties Inc
Home Financials for this Owner
Home Financials are based on the most recent Mortgage that was taken out on this home.
Original Mortgage
$113,400
Interest Rate
5.97%
Mortgage Type
New Conventional
Create a Home Valuation Report for This Property
The Home Valuation Report is an in-depth analysis detailing your home's value as well as a comparison with similar homes in the area
Home Values in the Area
Average Home Value in this Area
Purchase History
| Date | Buyer | Sale Price | Title Company |
|---|---|---|---|
| Murphy Lydia R | $115,000 | -- | |
| Cheek Matthew T | $113,400 | -- | |
| Southchase Properties Inc | $64,000 | -- |
Source: Public Records
Mortgage History
| Date | Status | Borrower | Loan Amount |
|---|---|---|---|
| Open | Murphy Lydia R | $117,296 | |
| Previous Owner | Cheek Matthew T | $113,400 |
Source: Public Records
Tax History Compared to Growth
Tax History
| Year | Tax Paid | Tax Assessment Tax Assessment Total Assessment is a certain percentage of the fair market value that is determined by local assessors to be the total taxable value of land and additions on the property. | Land | Improvement |
|---|---|---|---|---|
| 2025 | $3,067 | $122,400 | $31,240 | $91,160 |
| 2024 | $3,203 | $122,240 | $28,920 | $93,320 |
| 2023 | $2,742 | $102,720 | $13,920 | $88,800 |
| 2022 | $2,528 | $90,400 | $13,920 | $76,480 |
| 2021 | $1,855 | $62,960 | $13,920 | $49,040 |
| 2020 | $1,984 | $65,960 | $12,120 | $53,840 |
| 2019 | $1,881 | $61,600 | $12,120 | $49,480 |
| 2018 | $2,003 | $63,960 | $13,920 | $50,040 |
| 2017 | $1,576 | $49,400 | $13,920 | $35,480 |
| 2016 | $1,391 | $43,880 | $8,440 | $35,440 |
| 2015 | $848 | $23,960 | $4,200 | $19,760 |
| 2014 | $848 | $23,960 | $4,200 | $19,760 |
Source: Public Records
Map
Nearby Homes
- 3845 Chase Dr
- 3484 Baker Rd
- 3188 Baker Rd
- 14.4 ACRES Roy Parks Rd
- 9.3 ACRES Roy Parks Rd
- 8.2 ACRES Roy Parks Rd
- 7.5 ACRES Roy Parks Rd
- 01 Candler Rd
- 3300 Athens Hwy
- 2811 Athens Hwy
- 2804 Dorsey Peek Rd
- 6021 Cane Crossing Dr
- 3531 Pennington Trail Unit 2
- 6064 Cane Crossing Dr
- 5261 Hopewell Ln
- 3358 Pennington Point Dr
- 3185 Athens Hwy
- 5074 Peach Mountain Cir
- 5109 Peach Mountain Cir
- 3520 Silver Mist Cir
- 3575 Southchase Dr Unit 1
- 3568 Southchase Dr
- 3581 Southchase Dr
- 3578 Southchase Dr
- 3582 Southchase Dr Unit 17
- 3582 Southchase Dr
- 3561 Southchase Dr
- 3555 Southchase Dr Unit 1
- 3556 Southchase Dr
- 3556 Southchase Dr Unit 1/14
- 3874 Chase Dr Unit 2
- 3866 Chase Dr
- 3862 Chase Dr
- 3549 Southchase Dr Unit 1
- 3870 Chase Dr Unit 2
- 3858 Chase Dr Unit 2
- 3546 Southchase Dr
- 3854 Chase Dr
- 3882 Chase Dr Unit 2
- 3545 Southchase Dr