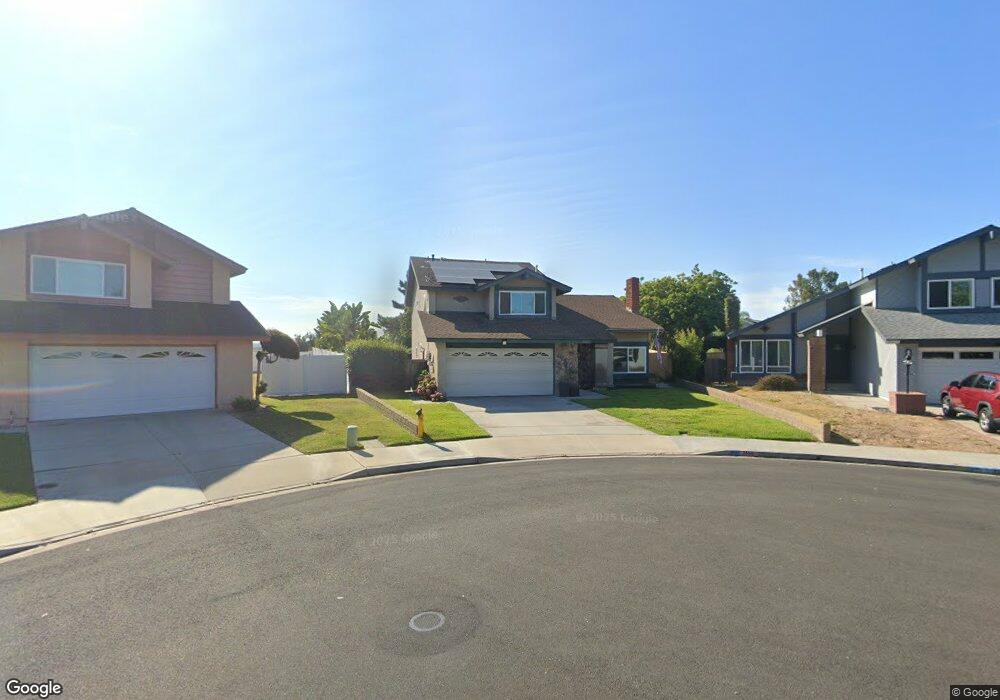
3569 Starboard Cir Unit LA4 Oceanside, CA 92054
Loma Alta NeighborhoodEstimated Value: $1,036,000 - $1,204,000
3
Beds
3
Baths
2,021
Sq Ft
$544/Sq Ft
Est. Value
About This Home
This home is located at 3569 Starboard Cir Unit LA4, Oceanside, CA 92054 and is currently estimated at $1,099,230, approximately $543 per square foot. 3569 Starboard Cir Unit LA4 is a home located in San Diego County with nearby schools including Lincoln Middle School, Oceanside High School, and Pacific View Charter School.
Ownership History
Date
Name
Owned For
Owner Type
Purchase Details
Closed on
Feb 22, 2021
Sold by
Hodges Christopher Albin and Albin Francis Hodges
Bought by
Brinkerhoff Blake and Brinkerhoff Janay
Current Estimated Value
Home Financials for this Owner
Home Financials are based on the most recent Mortgage that was taken out on this home.
Original Mortgage
$683,760
Outstanding Balance
$611,548
Interest Rate
2.7%
Mortgage Type
New Conventional
Estimated Equity
$487,682
Purchase Details
Closed on
May 14, 2010
Sold by
Albin Francis & Sara Jane Hodges Family
Bought by
Hodges Christopher
Purchase Details
Closed on
Apr 3, 2000
Sold by
Maggiacomo Joseph W and Rygg Lance C
Bought by
Holt Gregory J and Holt Tamra L
Purchase Details
Closed on
Sep 21, 1993
Sold by
Hodges Albin F and Hodges Sara Jane
Bought by
Hodges Albin Frances and Hodges Sara Jane
Create a Home Valuation Report for This Property
The Home Valuation Report is an in-depth analysis detailing your home's value as well as a comparison with similar homes in the area
Home Values in the Area
Average Home Value in this Area
Purchase History
We collect this data history from publicly available records. To have your information removed, we recommend requesting removal directly through your county’s website.
| Date | Buyer | Sale Price | Title Company |
|---|---|---|---|
| Brinkerhoff Blake | $660,000 | Ticor Title San Diego Branch | |
| Hodges Christopher | -- | None Available | |
| Holt Gregory J | $250,000 | First American Title | |
| Hodges Albin Frances | -- | -- |
Source: Public Records
Mortgage History
We collect this data history from publicly available records. To have your information removed, we recommend requesting removal directly through your county’s website.
| Date | Status | Borrower | Loan Amount |
|---|---|---|---|
| Open | Brinkerhoff Blake | $683,760 |
Source: Public Records
Tax History
| Year | Tax Paid | Tax Assessment Tax Assessment Total Assessment is a certain percentage of the fair market value that is determined by local assessors to be the total taxable value of land and additions on the property. | Land | Improvement |
|---|---|---|---|---|
| 2025 | $8,357 | $757,701 | $568,276 | $189,425 |
| 2024 | $8,357 | $742,845 | $557,134 | $185,711 |
| 2023 | $8,100 | $728,280 | $546,210 | $182,070 |
| 2022 | $7,978 | $714,000 | $535,500 | $178,500 |
| 2021 | $2,474 | $213,312 | $82,039 | $131,273 |
| 2020 | $2,321 | $211,125 | $81,198 | $129,927 |
| 2019 | $2,253 | $206,986 | $79,606 | $127,380 |
| 2018 | $2,228 | $202,929 | $78,046 | $124,883 |
| 2017 | $70 | $198,951 | $76,516 | $122,435 |
| 2016 | $2,113 | $195,051 | $75,016 | $120,035 |
| 2015 | $2,051 | $192,122 | $73,890 | $118,232 |
| 2014 | $1,972 | $188,359 | $72,443 | $115,916 |
Source: Public Records
Map
Nearby Homes
- 3397 Tonopah St
- 147 Tropicana Dr
- 327 Islander St
- 3263 Roberta Ln
- 223 Cottingham Ct
- 3561 Boussock Ln
- 128 Frontier Dr
- 3592 Boussock Ln
- 3621 Vista Campana S Unit 92
- 3621 Vista Campana S Unit 11
- 3621 Vista Campana S Unit 53
- 3621 Vista Campana S Unit 69
- 3621 Vista Campana S Unit 84
- 3621 Vista Campana S Unit 16
- 3621 Vista Campana S Unit 12
- 3598 Bartlett Ave
- 432 Edgehill Ln Unit 169
- 432 Edgehill Ln Unit 165
- 432 Edgehill Ln Unit 95
- 432 Edgehill Ln Unit 79
- 3565 Starboard Cir
- 3573 Starboard Cir
- 333 Mainsail Rd
- 3561 Starboard Cir
- 337 Mainsail Rd
- 3568 Starboard Cir
- 3562 Sea Ridge Rd
- 3558 Sea Ridge Rd
- 3564 Starboard Cir
- 3554 Sea Ridge Rd
- 339 Mainsail Rd
- 3560 Starboard Cir
- 329 Mainsail Rd
- 325 Mainsail Rd
- 3556 Starboard Cir
- 3548 Sea Ridge Rd
- 3552 Starboard Cir
- 3547 Starboard Cir
- 3362 Jibsail St
- 334 Mainsail Rd
Your Personal Tour Guide
Ask me questions while you tour the home.