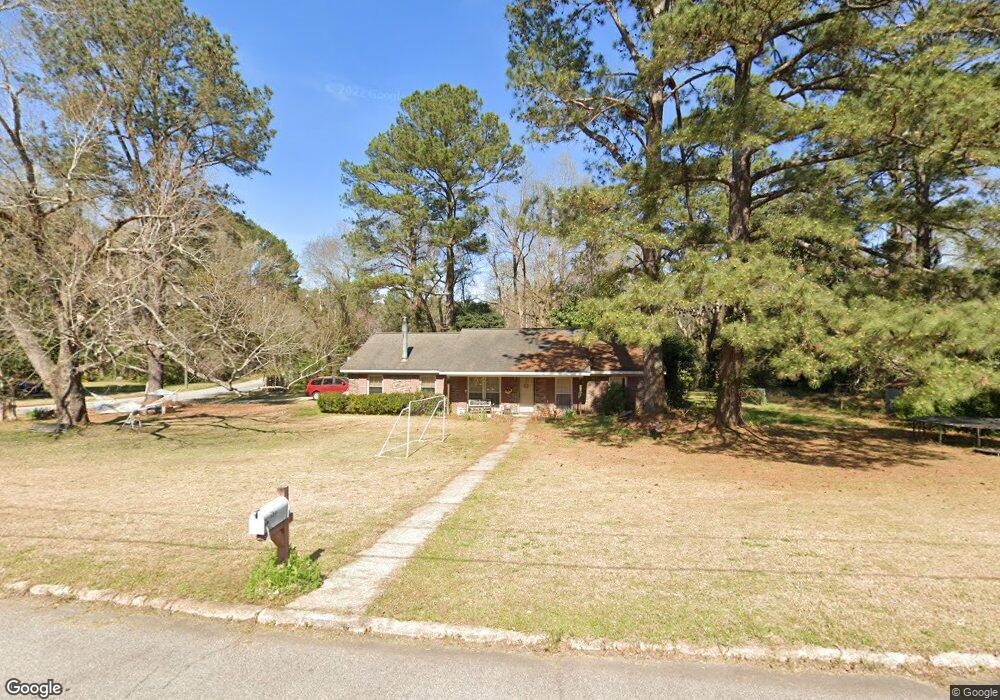
357 Brookridge Dr Lagrange, GA 30241
Estimated Value: $214,000 - $254,000
4
Beds
2
Baths
1,856
Sq Ft
$125/Sq Ft
Est. Value
About This Home
This home is located at 357 Brookridge Dr, Lagrange, GA 30241 and is currently estimated at $231,560, approximately $124 per square foot. 357 Brookridge Dr is a home located in Troup County with nearby schools including Franklin Forest Elementary School, Hollis Hand Elementary School, and Ethel W. Kight Elementary School.
Ownership History
Date
Name
Owned For
Owner Type
Purchase Details
Closed on
Jan 8, 1998
Sold by
Lebron Jeffery L and Lebron Gunter Fix
Bought by
Kresses Bart A and Kresses Laura D
Current Estimated Value
Purchase Details
Closed on
May 5, 1993
Sold by
Leslie B Chastain
Bought by
Lebron Jeffery L and Lebron Gunter Fix
Purchase Details
Closed on
Aug 13, 1991
Sold by
Masami Matsuura
Bought by
Leslie B Chastain
Purchase Details
Closed on
Feb 28, 1986
Sold by
Donna Joseph and Donna Harman
Bought by
Masami Matsuura
Purchase Details
Closed on
Jun 1, 1979
Bought by
Donna Joseph and Donna Harman
Purchase Details
Closed on
Jan 1, 1973
Sold by
Lewis Bell
Purchase Details
Closed on
Jan 1, 1971
Sold by
Wm Connie and Wm Smith
Bought by
Lewis Bell
Purchase Details
Closed on
Feb 1, 1970
Sold by
Lagrange Investment Co
Bought by
Wm Connie and Wm Smith
Purchase Details
Closed on
Sep 1, 1968
Sold by
Roy M Waller
Bought by
Lagrange Investment Co
Create a Home Valuation Report for This Property
The Home Valuation Report is an in-depth analysis detailing your home's value as well as a comparison with similar homes in the area
Purchase History
| Date | Buyer | Sale Price | Title Company |
|---|---|---|---|
| Kresses Bart A | $93,000 | -- | |
| Lebron Jeffery L | $73,100 | -- | |
| Leslie B Chastain | $68,400 | -- | |
| Masami Matsuura | $76,000 | -- | |
| Donna Joseph | -- | -- | |
| -- | -- | -- | |
| Lewis Bell | -- | -- | |
| Wm Connie | -- | -- | |
| Lagrange Investment Co | -- | -- |
Source: Public Records
Tax History
| Year | Tax Paid | Tax Assessment Tax Assessment Total Assessment is a certain percentage of the fair market value that is determined by local assessors to be the total taxable value of land and additions on the property. | Land | Improvement |
|---|---|---|---|---|
| 2025 | $1,762 | $70,520 | $10,000 | $60,520 |
| 2024 | $1,569 | $59,520 | $10,000 | $49,520 |
| 2023 | $980 | $1,259 | $0 | $1,259 |
| 2022 | $1,423 | $52,960 | $10,000 | $42,960 |
| 2021 | $1,222 | $42,520 | $8,000 | $34,520 |
| 2020 | $1,222 | $42,520 | $8,000 | $34,520 |
| 2019 | $1,124 | $39,240 | $8,000 | $31,240 |
| 2018 | $1,051 | $36,840 | $8,400 | $28,440 |
| 2017 | $1,051 | $36,840 | $8,400 | $28,440 |
| 2016 | $1,021 | $35,842 | $8,400 | $27,442 |
| 2015 | $1,023 | $35,842 | $8,400 | $27,442 |
| 2014 | $981 | $34,398 | $8,400 | $25,998 |
| 2013 | -- | $36,556 | $8,400 | $28,156 |
Source: Public Records
Map
Nearby Homes
- 102 Dogwood Dr
- 706 N Harlem Cir
- 203 Bonaventure Dr
- 202 Park Hill Dr
- 616 S Harlem Cir
- 224 Rutland Cir
- 131 Foch St
- 210 Hearthstone Dr
- 87 Youngs Mill Rd
- 900 North St
- 806 New Franklin Rd
- 110 Russell St
- 114 Briarcliff Rd
- 121 de Groat St
- 301 E Bacon St
- 204 Colonial St
- 204 Cleveland Dr
- 219 Banks St
- 212 Cleveland Dr
- 115 Clara Jean Ct
- 334 Hickory Terrace
- 358 Hickory Terrace
- 353 Hickory Terrace
- 334 Brookridge Dr
- 360 Hickory Terrace
- 356 Hickory Terrace
- 336 Brookridge Dr
- 338 Brookridge Dr
- 341 Brookridge Dr
- 330 Hickory Terrace
- 351 Laurel Ln
- 340 Brookridge Dr
- 361 Hickory Terrace
- 347 Laurel Ln
- 343 Brookridge Dr
- 342 Brookridge Dr
- 469 Camelot Ct
- 343 Laurel Ln
- 344 Brookridge Dr
- 328 Hickory Terrace Unit 16
Your Personal Tour Guide
Ask me questions while you tour the home.