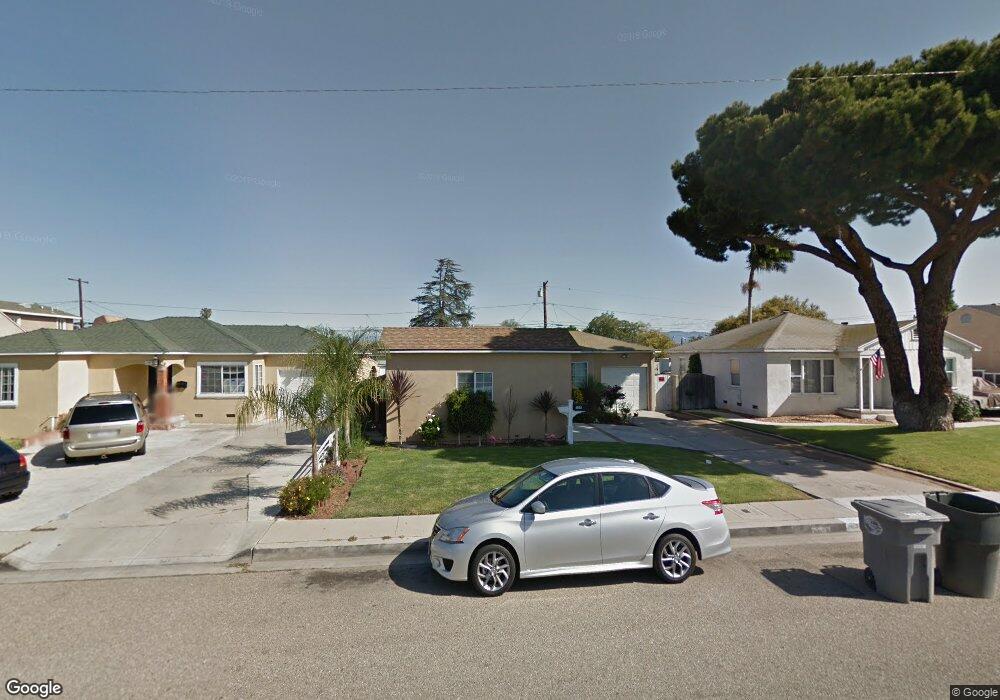
357 E Date St Oxnard, CA 93033
Cal-Gisler NeighborhoodEstimated Value: $466,000 - $701,464
2
Beds
1
Bath
1,305
Sq Ft
$445/Sq Ft
Est. Value
About This Home
This home is located at 357 E Date St, Oxnard, CA 93033 and is currently estimated at $580,366, approximately $444 per square foot. 357 E Date St is a home located in Ventura County with nearby schools including Elm Street Elementary School, R.J. Frank Academy of Marine Science & Engineering, and Santa Clara High School.
Ownership History
Date
Name
Owned For
Owner Type
Purchase Details
Closed on
Mar 23, 2010
Sold by
J G Holdings Ltd
Bought by
Villa Miguel Angel Morales and Ambriz Sagrario G
Current Estimated Value
Home Financials for this Owner
Home Financials are based on the most recent Mortgage that was taken out on this home.
Original Mortgage
$293,842
Outstanding Balance
$194,363
Interest Rate
4.94%
Mortgage Type
FHA
Estimated Equity
$386,003
Purchase Details
Closed on
Jun 6, 2009
Sold by
Us Bank National Association
Bought by
Jg Holdings Ltd
Purchase Details
Closed on
Aug 6, 2008
Sold by
Alatorre Javier and Alatorre Laura
Bought by
Us Bank Na
Purchase Details
Closed on
May 19, 2006
Sold by
Camacho Jesus
Bought by
Alatorre Javier and Alatorre Laura
Home Financials for this Owner
Home Financials are based on the most recent Mortgage that was taken out on this home.
Original Mortgage
$97,000
Interest Rate
6.57%
Mortgage Type
Credit Line Revolving
Purchase Details
Closed on
Nov 11, 2004
Sold by
Camacho Jamie
Bought by
Camacho Jesus
Home Financials for this Owner
Home Financials are based on the most recent Mortgage that was taken out on this home.
Original Mortgage
$302,000
Interest Rate
6.53%
Mortgage Type
New Conventional
Purchase Details
Closed on
Jan 29, 2004
Sold by
Camacho Cloromiro A and Camacho Rumalda E
Bought by
Camacho Jesus and Camacho Jamie
Home Financials for this Owner
Home Financials are based on the most recent Mortgage that was taken out on this home.
Original Mortgage
$283,000
Interest Rate
6.99%
Mortgage Type
Purchase Money Mortgage
Purchase Details
Closed on
Dec 9, 1998
Sold by
Cloromiro Camacho
Bought by
Camacho Cloromiro A and Camacho Rumalda E
Purchase Details
Closed on
Mar 18, 1996
Sold by
Cortez Ignacio and Cortez Emilia
Bought by
Cortez Rodolfo and Cortez Armando
Create a Home Valuation Report for This Property
The Home Valuation Report is an in-depth analysis detailing your home's value as well as a comparison with similar homes in the area
Home Values in the Area
Average Home Value in this Area
Purchase History
| Date | Buyer | Sale Price | Title Company |
|---|---|---|---|
| Villa Miguel Angel Morales | $300,000 | Chicago Title Company | |
| Jg Holdings Ltd | $145,000 | Fidelity National Title Ins | |
| Us Bank Na | $220,000 | None Available | |
| Alatorre Javier | $485,000 | Stewart Title Of Ca Inc | |
| Camacho Jesus | -- | First American Title Company | |
| Camacho Jesus | $315,000 | Ticor Title Company Of Ca | |
| Camacho Cloromiro A | -- | -- | |
| Cortez Rodolfo | -- | -- |
Source: Public Records
Mortgage History
| Date | Status | Borrower | Loan Amount |
|---|---|---|---|
| Open | Villa Miguel Angel Morales | $293,842 | |
| Previous Owner | Alatorre Javier | $97,000 | |
| Previous Owner | Alatorre Javier | $388,000 | |
| Previous Owner | Camacho Jesus | $302,000 | |
| Previous Owner | Camacho Jesus | $283,000 |
Source: Public Records
Tax History
| Year | Tax Paid | Tax Assessment Tax Assessment Total Assessment is a certain percentage of the fair market value that is determined by local assessors to be the total taxable value of land and additions on the property. | Land | Improvement |
|---|---|---|---|---|
| 2025 | $4,633 | $387,227 | $198,777 | $188,450 |
| 2024 | $4,633 | $379,635 | $194,880 | $184,755 |
| 2023 | $4,463 | $372,192 | $191,059 | $181,133 |
| 2022 | $4,327 | $364,895 | $187,313 | $177,582 |
| 2021 | $4,291 | $357,741 | $183,641 | $174,100 |
| 2020 | $4,370 | $354,075 | $181,759 | $172,316 |
| 2019 | $4,245 | $347,134 | $178,196 | $168,938 |
| 2018 | $4,184 | $340,328 | $174,702 | $165,626 |
| 2017 | $3,970 | $333,656 | $171,277 | $162,379 |
| 2016 | $3,831 | $327,115 | $167,919 | $159,196 |
| 2015 | $3,870 | $322,203 | $165,398 | $156,805 |
| 2014 | $3,258 | $268,000 | $137,000 | $131,000 |
Source: Public Records
Map
Nearby Homes
- 225 W Iris St
- 1239 S C St
- 1127 S C St
- 2024 S J St
- 865 S B St Unit Q1
- 819 S B St Unit 34
- 633 Meta St
- 2151 E Wooley Rd
- 3130 Paula St
- 3151 Fournier St
- 1030 Ilena St
- 550 S G St
- 603 S G St
- 3631 La Costa Place
- 1928 San Benito St
- 807 Kingfisher Way
- 1174 Oyster Place Unit 15
- 403 E 2nd St
- 3638 S B St
- 1431 Casa San Carlos Ln Unit B
Your Personal Tour Guide
Ask me questions while you tour the home.