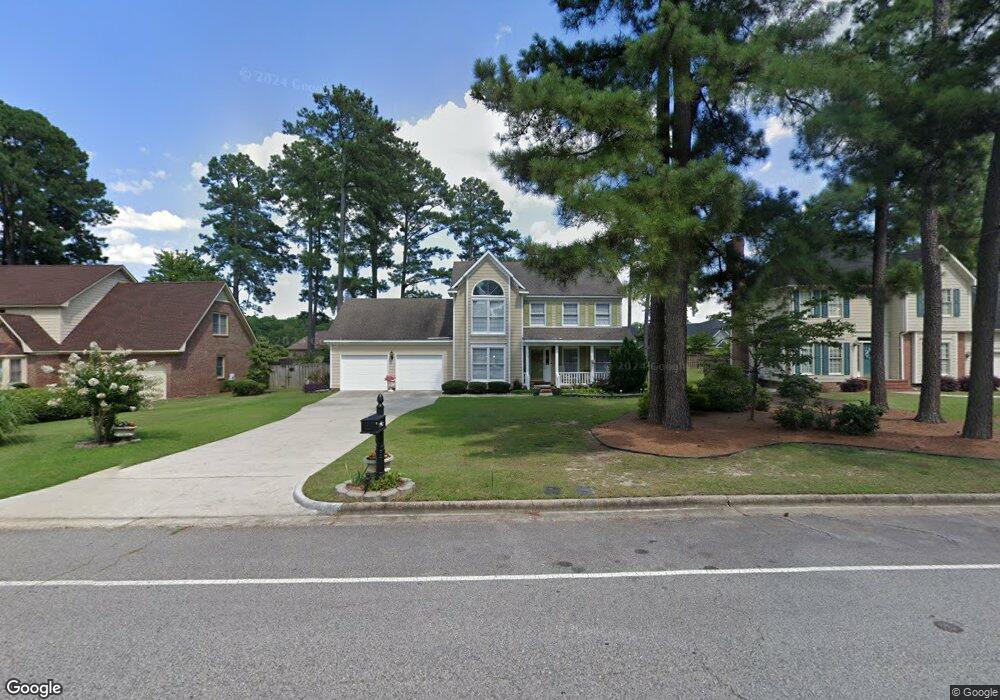
357 Hilliard Dr Fayetteville, NC 28311
Kings Grant NeighborhoodEstimated Value: $291,150 - $323,000
4
Beds
3
Baths
2,128
Sq Ft
$143/Sq Ft
Est. Value
About This Home
This home is located at 357 Hilliard Dr, Fayetteville, NC 28311 and is currently estimated at $304,038, approximately $142 per square foot. 357 Hilliard Dr is a home located in Cumberland County with nearby schools including Warrenwood Elementary, Luther Nick Jeralds Middle School, and E. E. Smith High School.
Ownership History
Date
Name
Owned For
Owner Type
Purchase Details
Closed on
Nov 21, 2014
Sold by
Vereen Delva L
Bought by
Vereen Delva L
Current Estimated Value
Home Financials for this Owner
Home Financials are based on the most recent Mortgage that was taken out on this home.
Original Mortgage
$147,600
Outstanding Balance
$113,067
Interest Rate
4%
Mortgage Type
New Conventional
Estimated Equity
$190,971
Purchase Details
Closed on
May 9, 2011
Sold by
Maynor Connell
Bought by
Vereen Delva L
Home Financials for this Owner
Home Financials are based on the most recent Mortgage that was taken out on this home.
Original Mortgage
$163,620
Interest Rate
4.75%
Mortgage Type
FHA
Purchase Details
Closed on
Apr 26, 2002
Sold by
Pulliam Earl
Bought by
Maynor Connell
Home Financials for this Owner
Home Financials are based on the most recent Mortgage that was taken out on this home.
Original Mortgage
$116,160
Interest Rate
7.07%
Mortgage Type
New Conventional
Create a Home Valuation Report for This Property
The Home Valuation Report is an in-depth analysis detailing your home's value as well as a comparison with similar homes in the area
Home Values in the Area
Average Home Value in this Area
Purchase History
| Date | Buyer | Sale Price | Title Company |
|---|---|---|---|
| Vereen Delva L | -- | -- | |
| Vereen Delva L | $180,000 | -- | |
| Maynor Connell | $146,000 | -- |
Source: Public Records
Mortgage History
| Date | Status | Borrower | Loan Amount |
|---|---|---|---|
| Open | Vereen Delva L | $147,600 | |
| Previous Owner | Vereen Delva L | $163,620 | |
| Previous Owner | Maynor Connell | $116,160 |
Source: Public Records
Tax History Compared to Growth
Tax History
| Year | Tax Paid | Tax Assessment Tax Assessment Total Assessment is a certain percentage of the fair market value that is determined by local assessors to be the total taxable value of land and additions on the property. | Land | Improvement |
|---|---|---|---|---|
| 2024 | $3,519 | $187,666 | $27,500 | $160,166 |
| 2023 | $3,030 | $187,666 | $27,500 | $160,166 |
| 2022 | $2,746 | $187,666 | $27,500 | $160,166 |
| 2021 | $2,746 | $187,666 | $27,500 | $160,166 |
| 2019 | $2,711 | $184,300 | $27,500 | $156,800 |
| 2018 | $2,711 | $184,300 | $27,500 | $156,800 |
| 2017 | $2,608 | $184,300 | $27,500 | $156,800 |
| 2016 | $2,579 | $197,000 | $27,500 | $169,500 |
| 2015 | $2,552 | $197,000 | $27,500 | $169,500 |
| 2014 | $2,545 | $197,000 | $27,500 | $169,500 |
Source: Public Records
Map
Nearby Homes
- 361 Hilliard Dr
- 353 Hilliard Dr
- 413 Dehavilland Dr
- 365 Hilliard Dr
- 601 Rockport Dr
- 600 Rockport Dr
- 366 Hilliard Dr
- 420 Selznick Place
- 349 Hilliard Dr
- 412 Dehavilland Dr
- 369 Hilliard Dr
- 350 Hilliard Dr
- 370 Hilliard Dr
- 409 Dehavilland Dr
- 605 Rockport Dr
- 416 Selznick Place
- 347 Hilliard Dr
- 605 Spy Glass Dr
- 371 Hilliard Dr
- 406 Dehavilland Dr