Estimated Value: $416,000 - $516,000
3
Beds
2
Baths
1,120
Sq Ft
$429/Sq Ft
Est. Value
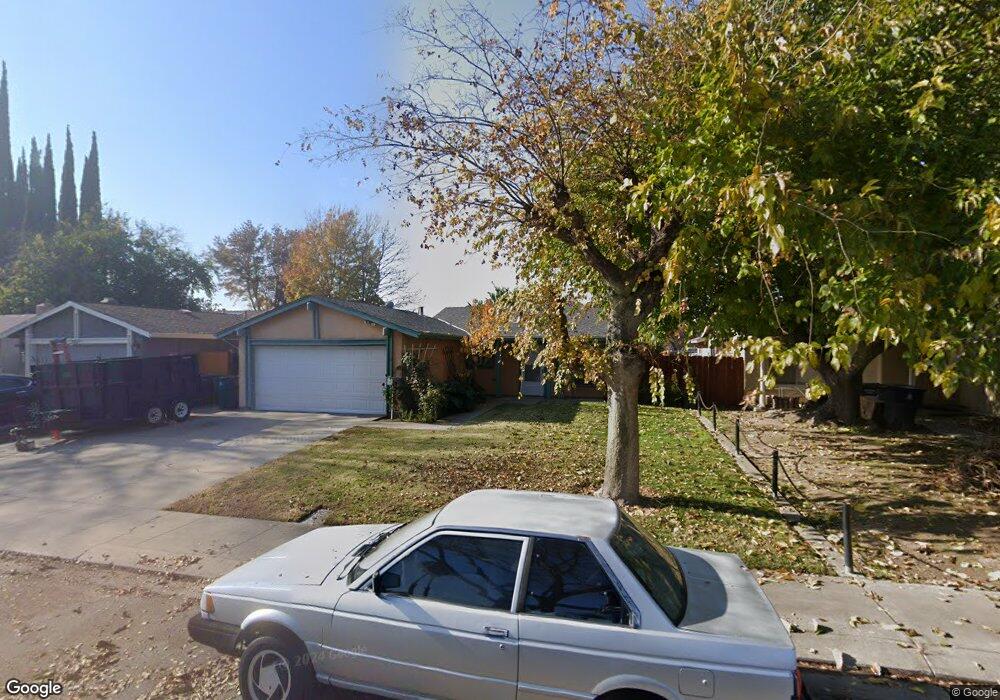
About This Home
This home is located at 357 N Hickory Ave, Tracy, CA 95376 and is currently estimated at $480,579, approximately $429 per square foot. 357 N Hickory Ave is a home located in San Joaquin County with nearby schools including Louis J. Villalovoz Elementary School, Earle E. Williams Middle School, and Merrill F. West High School.
Ownership History
Date
Name
Owned For
Owner Type
Purchase Details
Closed on
Nov 13, 2022
Sold by
Bedolla Jesus
Bought by
Bedolla Jesus and Bedolla Rosana
Current Estimated Value
Purchase Details
Closed on
Feb 22, 1999
Sold by
Antonio Reinosa and Lee Tee
Bought by
Bedolla Jesus
Home Financials for this Owner
Home Financials are based on the most recent Mortgage that was taken out on this home.
Original Mortgage
$138,600
Interest Rate
6.78%
Purchase Details
Closed on
Oct 20, 1994
Sold by
Sheline Diana L
Bought by
Reinosa Antonio and Reinosa Tee Lee
Home Financials for this Owner
Home Financials are based on the most recent Mortgage that was taken out on this home.
Original Mortgage
$115,900
Interest Rate
8.7%
Mortgage Type
FHA
Create a Home Valuation Report for This Property
The Home Valuation Report is an in-depth analysis detailing your home's value as well as a comparison with similar homes in the area
Home Values in the Area
Average Home Value in this Area
Purchase History
| Date | Buyer | Sale Price | Title Company |
|---|---|---|---|
| Bedolla Jesus | -- | -- | |
| Bedolla Jesus | $146,000 | Old Republic Title Company | |
| Reinosa Antonio | $116,000 | Fidelity National Title Co |
Source: Public Records
Mortgage History
| Date | Status | Borrower | Loan Amount |
|---|---|---|---|
| Previous Owner | Bedolla Jesus | $138,600 | |
| Previous Owner | Reinosa Antonio | $115,900 |
Source: Public Records
Tax History
| Year | Tax Paid | Tax Assessment Tax Assessment Total Assessment is a certain percentage of the fair market value that is determined by local assessors to be the total taxable value of land and additions on the property. | Land | Improvement |
|---|---|---|---|---|
| 2025 | $2,769 | $228,712 | $125,409 | $103,303 |
| 2024 | $2,560 | $224,228 | $122,950 | $101,278 |
| 2023 | $2,516 | $219,833 | $120,540 | $99,293 |
| 2022 | $2,462 | $215,524 | $118,177 | $97,347 |
| 2021 | $2,429 | $211,299 | $115,860 | $95,439 |
| 2020 | $2,410 | $209,133 | $114,672 | $94,461 |
| 2019 | $2,369 | $205,033 | $112,424 | $92,609 |
| 2018 | $2,326 | $201,014 | $110,220 | $90,794 |
| 2017 | $2,212 | $197,073 | $108,059 | $89,014 |
| 2016 | $2,231 | $193,210 | $105,941 | $87,269 |
| 2014 | $2,084 | $186,580 | $102,306 | $84,274 |
Source: Public Records
Map
Nearby Homes
- 740 Sequoia Blvd
- 50 S Hickory Ave
- 829 Palm Cir
- 1990 Harvest Landing Ct
- 1601 Spring Ct
- 8300 W 11th St
- 790 Everglades Ln
- 448 Burlington Dr
- 1830 Laurelgrove Ln
- 920 Taft Ave
- 864 Bogetti Ln
- 2132 Tennis Ln
- 1416 Audrey Dr
- 1706 Countrywood Ln
- 1651 W Beverly Place
- 1463 Evergreen Ct
- 2219 Yellowstone Ave
- 925 Colonial Ln
- 1745 Parkside Dr
- 2325 Alamo Ct
- 371 N Hickory Ave
- 343 N Hickory Ave
- 385 N Hickory Ave
- 329 N Hickory Ave
- 364 N Hickory Ave
- 378 N Hickory Ave
- 350 N Hickory Ave
- 315 N Hickory Ave
- 392 N Hickory Ave
- 336 N Hickory Ave
- 291 N Hickory Ave
- 425 N Hickory Ave
- 1473 Juniper Ct
- 1480 Cypress Dr
- 273 N Hickory Ave
- 1495 Cypress Dr
- 1520 Deer Run Ln
- 1494 Juniper Ct
- 1530 Deer Run Ln
- 1459 Juniper Ct
Your Personal Tour Guide
Ask me questions while you tour the home.