
Seller's Agent in 2018
Scott Beloian
WESTCOE REALTORS INC
(951) 809-2709
1 in this area
43 Total Sales
Estimated Value: $586,000 - $628,000
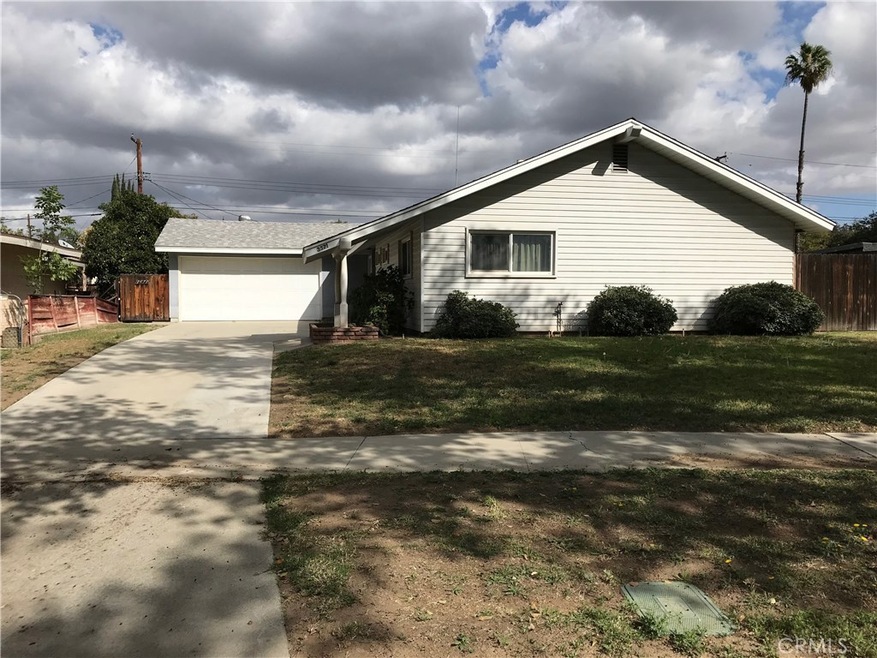
This home has newer windows and newer A/C - Furnace. Most everything else is in its original condition. Sold before print.
Last Agent to Sell the Property
WESTCOE REALTORS INC License #01302083 Listed on: 02/06/2018
We collect this data history from publicly available records. To have your information removed, we recommend requesting removal directly through your county’s website.
We collect this data history from publicly available records. To have your information removed, we recommend requesting removal directly through your county’s website.
| Date | Buyer | Sale Price | Title Company |
|---|---|---|---|
| $511,000 | Wfg National Title Co Of Ca | ||
| $320,000 | Ticor Title | ||
| -- | Ticor Title | ||
| -- | -- |
We collect this data history from publicly available records. To have your information removed, we recommend requesting removal directly through your county’s website.
| Date | Status | Borrower | Loan Amount |
|---|---|---|---|
| Previous Owner | $241,000 | ||
| Previous Owner | $240,000 |
We collect this data history from publicly available records. To have your information removed, we recommend requesting removal directly through your county’s website.
| Date | Event | Price | List to Sale | Price per Sq Ft |
|---|---|---|---|---|
| 03/22/2018 03/22/18 | Sold | $320,000 | -1.5% | $233 / Sq Ft |
| 02/14/2018 02/14/18 | Pending | -- | -- | -- |
| 02/06/2018 02/06/18 | For Sale | $325,000 | -- | $237 / Sq Ft |
We collect this data history from publicly available records. To have your information removed, we recommend requesting removal directly through your county’s website.
| Year | Tax Paid | Tax Assessment Tax Assessment Total Assessment is a certain percentage of the fair market value that is determined by local assessors to be the total taxable value of land and additions on the property. | Land | Improvement |
|---|---|---|---|---|
| 2025 | $5,884 | $542,276 | $95,508 | $446,768 |
| 2023 | $5,884 | $521,220 | $91,800 | $429,420 |
| 2022 | $5,751 | $511,000 | $90,000 | $421,000 |
| 2021 | $3,836 | $336,377 | $94,606 | $241,771 |
| 2020 | $3,807 | $332,928 | $93,636 | $239,292 |
| 2019 | $3,736 | $326,400 | $91,800 | $234,600 |
| 2018 | $3,585 | $320,000 | $80,000 | $240,000 |
| 2017 | $689 | $61,061 | $17,614 | $43,447 |
| 2016 | $648 | $59,865 | $17,269 | $42,596 |
| 2015 | $637 | $58,967 | $17,010 | $41,957 |
| 2014 | $629 | $57,814 | $16,678 | $41,136 |
Seller's Agent in 2018
Scott Beloian
WESTCOE REALTORS INC
(951) 809-2709
1 in this area
43 Total Sales
Buyer's Agent in 2018
Laura Folsom
WESTCOE REALTORS INC
(951) 532-0091
1 in this area
50 Total Sales
Source: California Regional Multiple Listing Service (CRMLS)
MLS Number: IV18049239
APN: 230-061-004
Disclaimer: Certain information contained herein is derived from information provided by parties other than Homes.com. All information provided is deemed reliable, but is not guaranteed to be accurate and should be independently verified.
![]() The multiple listing data appearing on this website, or contained in reports produced therefrom, is owned and copyrighted by California Regional Multiple Listing Service, Inc. ("CRMLS") and is protected by all applicable copyright laws. Information provided is for viewer's personal, non-commercial use and may not be used for any purpose other than to identify prospective properties the viewer may be interested in purchasing. All listing data, including but not limited to square footage and lot size is believed to be accurate, but the listing Agent, listing Broker and CRMLS and its affiliates do not warrant or guarantee such accuracy. The viewer should independently verify the listed data prior to making any decisions based on such information by personal inspection and/or contacting a real estate professional.
The multiple listing data appearing on this website, or contained in reports produced therefrom, is owned and copyrighted by California Regional Multiple Listing Service, Inc. ("CRMLS") and is protected by all applicable copyright laws. Information provided is for viewer's personal, non-commercial use and may not be used for any purpose other than to identify prospective properties the viewer may be interested in purchasing. All listing data, including but not limited to square footage and lot size is believed to be accurate, but the listing Agent, listing Broker and CRMLS and its affiliates do not warrant or guarantee such accuracy. The viewer should independently verify the listed data prior to making any decisions based on such information by personal inspection and/or contacting a real estate professional.
Based on information from California Regional Multiple Listing Service, Inc. and /or other sources. All data, including all measurements and calculations of area, is obtained from various sources and has not been, and will not be, verified by broker or MLS. All information should be independently reviewed and verified for accuracy. Properties may or may not be listed by the office/agent presenting the information
Ask me questions while you tour the home.