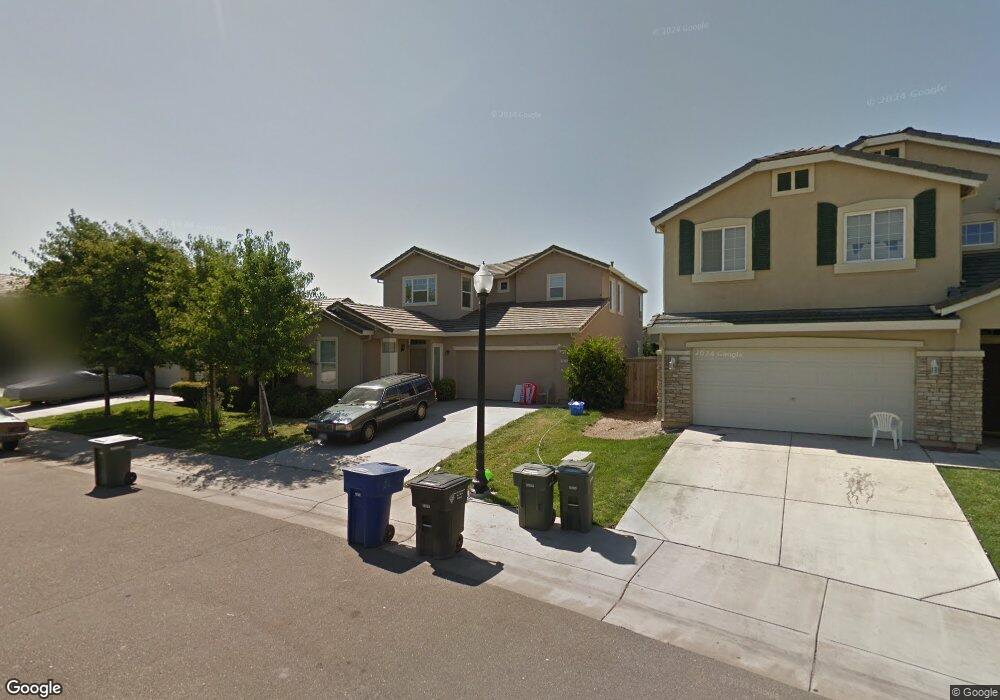
3571 Loggerhead Way Sacramento, CA 95834
Gateway West NeighborhoodEstimated Value: $588,439 - $630,000
5
Beds
3
Baths
2,448
Sq Ft
$251/Sq Ft
Est. Value
About This Home
This home is located at 3571 Loggerhead Way, Sacramento, CA 95834 and is currently estimated at $613,860, approximately $250 per square foot. 3571 Loggerhead Way is a home located in Sacramento County with nearby schools including Witter Ranch Elementary School, Natomas Middle School, and Inderkum High School.
Ownership History
Date
Name
Owned For
Owner Type
Purchase Details
Closed on
Mar 2, 2015
Sold by
Bui Khoa Dinh
Bought by
Tran Loan Thi
Current Estimated Value
Home Financials for this Owner
Home Financials are based on the most recent Mortgage that was taken out on this home.
Original Mortgage
$182,000
Outstanding Balance
$65,250
Interest Rate
3.61%
Mortgage Type
New Conventional
Estimated Equity
$548,610
Purchase Details
Closed on
Nov 5, 2004
Sold by
Bui Khoa Dinh
Bought by
Bui Khoa Dinh and Tran Loan Thi
Home Financials for this Owner
Home Financials are based on the most recent Mortgage that was taken out on this home.
Original Mortgage
$304,032
Interest Rate
5.37%
Mortgage Type
Purchase Money Mortgage
Purchase Details
Closed on
Sep 20, 2004
Sold by
Ryland Homes Of California Inc
Bought by
Bui Khoa Dinh
Home Financials for this Owner
Home Financials are based on the most recent Mortgage that was taken out on this home.
Original Mortgage
$304,032
Interest Rate
5.37%
Mortgage Type
Purchase Money Mortgage
Create a Home Valuation Report for This Property
The Home Valuation Report is an in-depth analysis detailing your home's value as well as a comparison with similar homes in the area
Home Values in the Area
Average Home Value in this Area
Purchase History
| Date | Buyer | Sale Price | Title Company |
|---|---|---|---|
| Tran Loan Thi | $91,000 | First American Title | |
| Bui Khoa Dinh | -- | -- | |
| Bui Khoa Dinh | $386,500 | First American Title Co |
Source: Public Records
Mortgage History
| Date | Status | Borrower | Loan Amount |
|---|---|---|---|
| Open | Tran Loan Thi | $182,000 | |
| Previous Owner | Bui Khoa Dinh | $304,032 |
Source: Public Records
Tax History
| Year | Tax Paid | Tax Assessment Tax Assessment Total Assessment is a certain percentage of the fair market value that is determined by local assessors to be the total taxable value of land and additions on the property. | Land | Improvement |
|---|---|---|---|---|
| 2025 | $7,357 | $538,242 | $88,782 | $449,460 |
| 2024 | $7,357 | $527,690 | $87,042 | $440,648 |
| 2023 | $6,958 | $517,344 | $85,336 | $432,008 |
| 2022 | $6,805 | $507,201 | $83,663 | $423,538 |
| 2021 | $6,836 | $497,257 | $82,023 | $415,234 |
| 2020 | $6,018 | $425,626 | $70,205 | $355,421 |
| 2019 | $5,827 | $409,256 | $67,505 | $341,751 |
| 2018 | $5,570 | $397,337 | $65,539 | $331,798 |
| 2017 | $5,332 | $382,056 | $63,019 | $319,037 |
| 2016 | $5,033 | $353,756 | $58,351 | $295,405 |
| 2015 | $4,763 | $336,912 | $55,573 | $281,339 |
| 2014 | $4,400 | $320,869 | $52,927 | $267,942 |
Source: Public Records
Map
Nearby Homes
- 2696 Screech Owl Way
- 3014 Great Egret Way
- 3045 Delta Tule Way
- 2924 Chateau Montelena Way
- 247 Dragonfly Cir
- 23 Delta Tule Ct
- 2968 Tourbrook Way
- 2807 Tourbrook Way
- 3805 Amelia Rose Way
- 171 Groth Cir
- 3042 Tintorera Way
- 3053 Touchman St
- 130 Groth Cir
- 2516 John Glenn Way
- 3039 Torland St
- 3005 Touchman St
- 3541 Tice Creek Way
- 2442 Buzz Aldrin Way
- 3481 Tice Creek Way
- 2543 Judith Resnik Ave
- 3565 Loggerhead Way
- 3577 Loggerhead Way
- 3559 Loggerhead Way
- 2804 Screech Owl Way
- 2810 Screech Owl Way
- 2798 Screech Owl Way
- 2816 Screech Owl Way
- 3553 Loggerhead Way
- 3578 Loggerhead Way
- 3566 Loggerhead Way
- 3560 Loggerhead Way
- 3547 Loggerhead Way
- 2822 Screech Owl Way
- 3517 Ahart Way
- 3554 Loggerhead Way
- 3523 Ahart Way
- 3511 Ahart Way
- 2772 Screech Owl Way
- 3548 Loggerhead Way
- 3541 Loggerhead Way
Your Personal Tour Guide
Ask me questions while you tour the home.