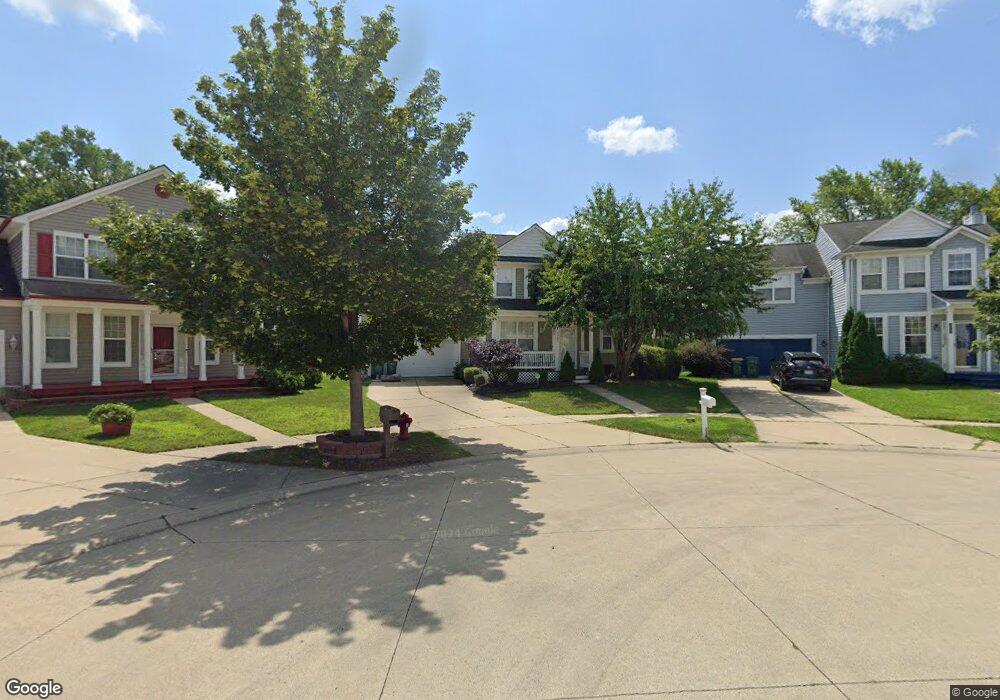
35749 Surrey Ct Romulus, MI 48174
Estimated Value: $310,987 - $365,000
4
Beds
3
Baths
1,978
Sq Ft
$174/Sq Ft
Est. Value
About This Home
This home is located at 35749 Surrey Ct, Romulus, MI 48174 and is currently estimated at $344,997, approximately $174 per square foot. 35749 Surrey Ct is a home with nearby schools including Wick Elementary School, Romulus Middle School, and Romulus Senior High School.
Ownership History
Date
Name
Owned For
Owner Type
Purchase Details
Closed on
Apr 6, 2019
Sold by
Law Karone L
Bought by
Law Karone L and Williams Law Zelah
Current Estimated Value
Home Financials for this Owner
Home Financials are based on the most recent Mortgage that was taken out on this home.
Original Mortgage
$159,000
Outstanding Balance
$139,789
Interest Rate
4.3%
Mortgage Type
New Conventional
Estimated Equity
$205,208
Purchase Details
Closed on
Oct 18, 2007
Sold by
Hughes Treva
Bought by
Law Karone
Purchase Details
Closed on
Mar 7, 2007
Sold by
Mortgage Electronic Registration Systems
Bought by
Bank Of New York and Cwabs Inc Asset Backed Certificates Seri
Purchase Details
Closed on
Nov 29, 2006
Sold by
Montaque Dwayne E and Montaque Janice E Lloyd
Bought by
Mortgage Electronic Registration Systems
Purchase Details
Closed on
Aug 2, 2005
Sold by
Gerald Roux Homes Inc
Bought by
Montaque Dwayne E
Purchase Details
Closed on
Nov 10, 2003
Sold by
Elro Corp
Bought by
Gerald Roux Homes Inc
Create a Home Valuation Report for This Property
The Home Valuation Report is an in-depth analysis detailing your home's value as well as a comparison with similar homes in the area
Home Values in the Area
Average Home Value in this Area
Purchase History
| Date | Buyer | Sale Price | Title Company |
|---|---|---|---|
| Law Karone L | -- | Servicelink | |
| Law Karone | $150,000 | Lawyers Title | |
| Bank Of New York | -- | None Available | |
| Mortgage Electronic Registration Systems | $218,791 | None Available | |
| Montaque Dwayne E | $220,776 | Multiple | |
| Gerald Roux Homes Inc | $47,500 | Greco |
Source: Public Records
Mortgage History
| Date | Status | Borrower | Loan Amount |
|---|---|---|---|
| Open | Law Karone L | $159,000 |
Source: Public Records
Tax History
| Year | Tax Paid | Tax Assessment Tax Assessment Total Assessment is a certain percentage of the fair market value that is determined by local assessors to be the total taxable value of land and additions on the property. | Land | Improvement |
|---|---|---|---|---|
| 2025 | $2,351 | $150,700 | $0 | $0 |
| 2024 | $2,362 | $142,000 | $0 | $0 |
| 2023 | $2,264 | $129,100 | $0 | $0 |
| 2022 | $2,698 | $115,000 | $0 | $0 |
| 2021 | $2,610 | $104,500 | $0 | $0 |
| 2020 | $2,557 | $94,700 | $0 | $0 |
| 2019 | $2,453 | $81,900 | $0 | $0 |
| 2018 | $1,586 | $74,900 | $0 | $0 |
| 2017 | $1,218 | $74,200 | $0 | $0 |
| 2016 | $2,109 | $58,800 | $0 | $0 |
| 2015 | $4,196 | $45,400 | $0 | $0 |
| 2013 | $4,200 | $45,700 | $0 | $0 |
| 2012 | $1,401 | $50,600 | $6,500 | $44,100 |
Source: Public Records
Map
Nearby Homes
- 35773 Surrey Ct
- 8080 Wayne Rd
- 35344 Ecorse Rd
- 000 Waynecorse
- 9274 Chamberlain St
- 9286 Chamberlain St
- 37207 Ecorse Rd
- 36227 Vinewood St
- 35799 Park Place
- 7175 Ozga St
- 35431 Beverly Rd
- 9535 Chamberlain St
- 6327 Hunt St
- 34956 Michelle Dr
- 0000 Park Place
- 6358 Dexter St
- 11630 Ozga St
- 7063 Sargent St
- Lot 215 2nd St
- Lot 214 2nd St
- 35761 Surrey Ct
- 35721 Surrey Ct
- 35773 Surrey Dr
- 35726 Surrey Ct
- 35785 Surrey Ct
- 7945 Surrey Dr
- 35750 Surrey Ct
- 35797 Surrey Ct
- 7921 Surrey Dr
- 7897 Surrey Dr
- 7956 Surrey Dr
- 7968 Surrey Dr
- 35723 Sussex Ct
- 35699 Sussex Ct
- 35749 Sussex Ct
- 7944 Surrey Dr
- 7920 Surrey Dr
- 35775 Sussex Ct
- 7896 Surrey Dr
- 35674 Sussex Ct
Your Personal Tour Guide
Ask me questions while you tour the home.