3575 N Prospectors Rd Apache Junction, AZ 85119
Estimated Value: $682,364 - $955,000
Studio
--
Bath
3,474
Sq Ft
$229/Sq Ft
Est. Value
About This Home
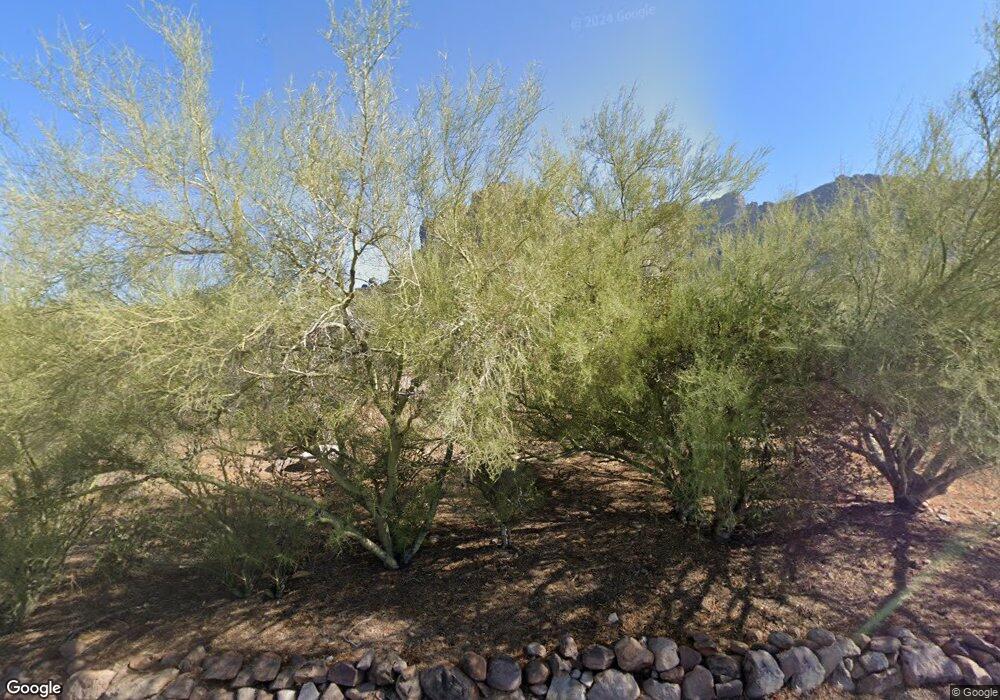
This home is located at 3575 N Prospectors Rd, Apache Junction, AZ 85119 and is currently estimated at $796,091, approximately $229 per square foot. 3575 N Prospectors Rd is a home located in Pinal County with nearby schools including Desert Vista Elementary School, Cactus Canyon Junior High School, and Apache Junction High School.
Ownership History
Date
Name
Owned For
Owner Type
Purchase Details
Closed on
Aug 21, 1998
Sold by
Loyer Harold B and Loyer Penelope F
Bought by
Heinauer Wayne R and Heinauer Diane G
Current Estimated Value
Home Financials for this Owner
Home Financials are based on the most recent Mortgage that was taken out on this home.
Original Mortgage
$183,500
Interest Rate
6.91%
Mortgage Type
New Conventional
Purchase Details
Closed on
Jul 15, 1995
Sold by
Smith Thomas H and Smith Sandra Lee
Bought by
Loyer Harold B and Loyer Penelope F
Home Financials for this Owner
Home Financials are based on the most recent Mortgage that was taken out on this home.
Original Mortgage
$190,000
Interest Rate
7.63%
Mortgage Type
New Conventional
Create a Home Valuation Report for This Property
The Home Valuation Report is an in-depth analysis detailing your home's value as well as a comparison with similar homes in the area
Home Values in the Area
Average Home Value in this Area
Purchase History
| Date | Buyer | Sale Price | Title Company |
|---|---|---|---|
| Heinauer Wayne R | $230,500 | Ati Title Agency Of Arizona | |
| Loyer Harold B | $225,000 | Old Republic Title Agency |
Source: Public Records
Mortgage History
| Date | Status | Borrower | Loan Amount |
|---|---|---|---|
| Previous Owner | Heinauer Wayne R | $183,500 | |
| Previous Owner | Loyer Harold B | $190,000 |
Source: Public Records
Tax History
| Year | Tax Paid | Tax Assessment Tax Assessment Total Assessment is a certain percentage of the fair market value that is determined by local assessors to be the total taxable value of land and additions on the property. | Land | Improvement |
|---|---|---|---|---|
| 2025 | $2,879 | $47,171 | -- | -- |
| 2024 | $2,705 | $46,108 | -- | -- |
| 2023 | $2,832 | $43,383 | $14,060 | $29,323 |
| 2022 | $2,705 | $30,233 | $8,180 | $22,053 |
| 2021 | $2,791 | $28,171 | $0 | $0 |
| 2020 | $2,722 | $27,744 | $0 | $0 |
| 2019 | $2,605 | $27,147 | $0 | $0 |
| 2018 | $2,548 | $23,173 | $0 | $0 |
| 2017 | $2,483 | $22,383 | $0 | $0 |
| 2016 | $2,407 | $22,262 | $7,798 | $14,464 |
| 2014 | $2,312 | $15,150 | $4,354 | $10,797 |
Source: Public Records
Map
Nearby Homes
- 3086 N Herrala Way
- 0 E Boulder St Lot B --
- 0 E Boulder Lot A St Unit 6900708
- 0 E Boulder St D --
- 0 E Boulder St Lot C --
- 2652 S Prospector Point Rd
- 2635 N Prospectors Rd
- 5063 E Reavis St
- 62XX E Reavis St
- 5850 E Concho St
- 2030 N Don Peralta Rd
- 4979 E Pioneer St
- 3700 E Hwy88 -- Unit 4
- 3826 N Rain Cloud Dr
- 4924 E Roundup St Unit 1 (A)
- 1532 N Roadrunner Rd
- 5029 E Roundup St
- 1165 N Mountain View Rd
- 5130 E Superstition Blvd
- 945 N Mountain View Rd
- 3539 N Prospectors Rd
- 3633 N Prospectors Rd
- 3556 N Prospectors Rd
- 3685 N Prospectors Rd
- 3640 N Prospectors Rd
- 3636 N La Barge Rd
- 3690 N Prospectors Rd
- 6110 E Reavis St
- 3682 N La Barge Rd
- 3602 N La Barge Rd Unit 2
- 3602 N La Barge Rd Unit 3
- 3602 N La Barge Rd
- 6089 E Mining Camp St
- 3430 N Prospectors Rd
- 5895 E Bell St
- 3724 N Prospectors Rd
- 5900 E Bell St
- 3724 N La Barge Rd
- 0 E Mining Camp St Unit 21D 4405461
Your Personal Tour Guide
Ask me questions while you tour the home.