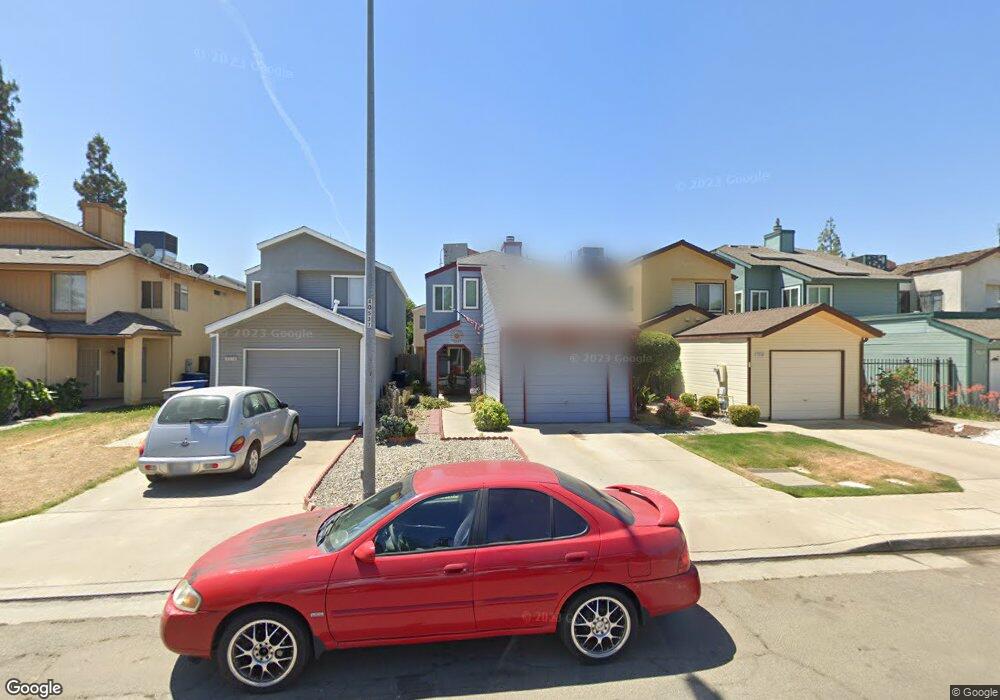
3577 W Harvard Ave Fresno, CA 93722
West Fresno NeighborhoodEstimated Value: $291,000 - $313,000
3
Beds
2
Baths
1,388
Sq Ft
$218/Sq Ft
Est. Value
About This Home
This home is located at 3577 W Harvard Ave, Fresno, CA 93722 and is currently estimated at $302,061, approximately $217 per square foot. 3577 W Harvard Ave is a home located in Fresno County with nearby schools including Hanh Phan Tilley Elementary, El Capitan Middle School, and Central East High School.
Ownership History
Date
Name
Owned For
Owner Type
Purchase Details
Closed on
Aug 25, 2008
Sold by
Citibank Na
Bought by
Jeffrey Ryan and Jeffrey Paula
Current Estimated Value
Home Financials for this Owner
Home Financials are based on the most recent Mortgage that was taken out on this home.
Original Mortgage
$93,993
Outstanding Balance
$62,727
Interest Rate
6.59%
Mortgage Type
FHA
Estimated Equity
$239,334
Purchase Details
Closed on
Feb 28, 2008
Sold by
Meyer Eric and Meyer Jenny
Bought by
Citibank Na and First Franklin Mortgage Loan Trust
Purchase Details
Closed on
Aug 17, 2005
Sold by
Weber Michael L and Weber Claudia A
Bought by
Meyer Eric and Meyer Jenny
Home Financials for this Owner
Home Financials are based on the most recent Mortgage that was taken out on this home.
Original Mortgage
$176,000
Interest Rate
6.12%
Mortgage Type
Stand Alone First
Create a Home Valuation Report for This Property
The Home Valuation Report is an in-depth analysis detailing your home's value as well as a comparison with similar homes in the area
Home Values in the Area
Average Home Value in this Area
Purchase History
| Date | Buyer | Sale Price | Title Company |
|---|---|---|---|
| Jeffrey Ryan | $95,000 | Placer Title Company | |
| Citibank Na | $191,393 | Accommodation | |
| Meyer Eric | $220,000 | Fidelity National Title Co |
Source: Public Records
Mortgage History
| Date | Status | Borrower | Loan Amount |
|---|---|---|---|
| Open | Jeffrey Ryan | $93,993 | |
| Previous Owner | Meyer Eric | $176,000 |
Source: Public Records
Tax History Compared to Growth
Tax History
| Year | Tax Paid | Tax Assessment Tax Assessment Total Assessment is a certain percentage of the fair market value that is determined by local assessors to be the total taxable value of land and additions on the property. | Land | Improvement |
|---|---|---|---|---|
| 2025 | $4,638 | $160,957 | $77,259 | $83,698 |
| 2023 | $4,589 | $154,709 | $74,260 | $80,449 |
| 2022 | $4,481 | $151,676 | $72,804 | $78,872 |
| 2021 | $4,493 | $148,703 | $71,377 | $77,326 |
| 2020 | $4,404 | $147,180 | $70,646 | $76,534 |
| 2019 | $4,376 | $144,295 | $69,261 | $75,034 |
| 2018 | $4,336 | $141,466 | $67,903 | $73,563 |
| 2017 | $1,651 | $138,693 | $66,572 | $72,121 |
| 2016 | $1,520 | $135,974 | $65,267 | $70,707 |
| 2015 | $1,299 | $115,700 | $55,500 | $60,200 |
| 2014 | $1,236 | $108,400 | $52,000 | $56,400 |
Source: Public Records
Map
Nearby Homes
- 3630 W Terrace Ave
- 3546 W Harvard Ave
- 3656 W Harvard Ave
- 3670 W Terrace Ave
- 3256 W Clinton Ave
- 2691 N Brawley Ave
- 2789 N Selland Ave
- 2413 N Sonora Ave
- 4189 W Providence Ave
- 3425 W Forrest Dr
- 2387 N Hanover Ave
- 2260 N Hanover Ave
- 3374 W Shields Ave Unit 101-4
- 3288 W Mckinley Ave
- 3472 W Cortland Ave Unit 97
- 3342 W Shields Ave
- 4360 W Vassar Ave
- 3154 W Mckinley Ave
- 2209 N Marks Ave
- 3185 W Mckinley Ave
- 3573 W Harvard Ave
- 3581 W Harvard Ave
- 3569 W Harvard Ave
- 3585 W Harvard Ave
- 3589 W Harvard Ave
- 3565 W Harvard Ave
- 3578 W Terrace Ave
- 3591 W Harvard Ave
- 3574 W Terrace Ave
- 3586 W Terrace Ave
- 3570 W Terrace Ave
- 3566 W Terrace Ave
- 3590 W Terrace Ave
- 3595 W Harvard Ave
- 3592 W Terrace Ave
- 3566 W Harvard Ave
- 3597 W Harvard Ave
- 3572 W Harvard Ave
- 3580 W Harvard Ave
- 3596 W Terrace Ave