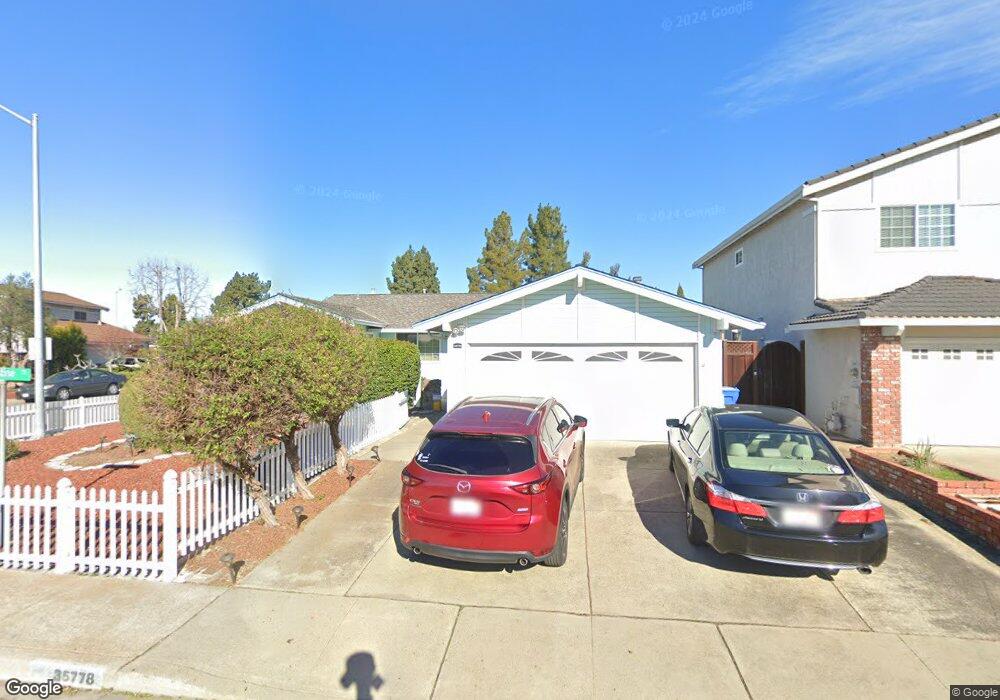
35778 Augustine Ct Fremont, CA 94536
Brookvale NeighborhoodEstimated Value: $1,730,000 - $1,909,000
4
Beds
2
Baths
1,732
Sq Ft
$1,061/Sq Ft
Est. Value
About This Home
This home is located at 35778 Augustine Ct, Fremont, CA 94536 and is currently estimated at $1,837,956, approximately $1,061 per square foot. 35778 Augustine Ct is a home located in Alameda County with nearby schools including Brookvale Elementary School, Thornton Middle School, and American High School.
Ownership History
Date
Name
Owned For
Owner Type
Purchase Details
Closed on
Mar 10, 2017
Sold by
Morgan Valerie and Morgan Cara
Bought by
Mao Hongda and Zhu Min
Current Estimated Value
Home Financials for this Owner
Home Financials are based on the most recent Mortgage that was taken out on this home.
Original Mortgage
$852,000
Outstanding Balance
$690,261
Interest Rate
3.37%
Mortgage Type
Adjustable Rate Mortgage/ARM
Estimated Equity
$1,147,695
Purchase Details
Closed on
Mar 31, 2014
Sold by
Wynne Valerie Morgan and Morgan Cara M
Bought by
Morgan Valerie and Morgan Cara
Purchase Details
Closed on
Jan 26, 2000
Sold by
Morgan Gail
Bought by
Morgan Gail and R & G Morgan 1993 Revocable Li
Home Financials for this Owner
Home Financials are based on the most recent Mortgage that was taken out on this home.
Original Mortgage
$94,392
Interest Rate
8.16%
Mortgage Type
Seller Take Back
Create a Home Valuation Report for This Property
The Home Valuation Report is an in-depth analysis detailing your home's value as well as a comparison with similar homes in the area
Home Values in the Area
Average Home Value in this Area
Purchase History
| Date | Buyer | Sale Price | Title Company |
|---|---|---|---|
| Mao Hongda | $1,065,000 | Chicago Title Company | |
| Morgan Valerie | -- | None Available | |
| Morgan Gail | -- | -- |
Source: Public Records
Mortgage History
| Date | Status | Borrower | Loan Amount |
|---|---|---|---|
| Open | Mao Hongda | $852,000 | |
| Previous Owner | Morgan Gail | $94,392 |
Source: Public Records
Tax History
| Year | Tax Paid | Tax Assessment Tax Assessment Total Assessment is a certain percentage of the fair market value that is determined by local assessors to be the total taxable value of land and additions on the property. | Land | Improvement |
|---|---|---|---|---|
| 2025 | $14,468 | $1,228,996 | $435,210 | $800,786 |
| 2024 | $14,468 | $1,204,766 | $426,678 | $785,088 |
| 2023 | $14,090 | $1,188,007 | $418,312 | $769,695 |
| 2022 | $13,922 | $1,157,715 | $410,111 | $754,604 |
| 2021 | $13,576 | $1,134,882 | $402,071 | $739,811 |
| 2020 | $13,663 | $1,130,178 | $397,950 | $732,228 |
| 2019 | $13,504 | $1,108,026 | $390,150 | $717,876 |
| 2018 | $13,241 | $1,086,300 | $382,500 | $703,800 |
| 2017 | $1,616 | $94,815 | $16,053 | $78,762 |
| 2016 | $1,572 | $92,956 | $15,738 | $77,218 |
| 2015 | $1,537 | $91,560 | $15,502 | $76,058 |
| 2014 | $1,499 | $89,766 | $15,198 | $74,568 |
Source: Public Records
Map
Nearby Homes
- 2896 Harrisburg Ave
- 35037 Begonia St
- 35429 Galen Place
- 35234 Cornish Dr
- 36500 Alder Ct
- 34839 Clover St
- 3433 Surry Place
- 3184 Waugh Place
- 34803 Hollyhock St
- 34819 Clover St
- 2921 Daisy Ct
- 2903 Begonia St
- 2102 Farrol Ave
- 35039 Peco St
- 2655 Barrington Terrace
- 36957 Reynolds Dr
- 34926 Moina Shaiq Common
- 36640 Oak St
- 3371 Baywood Terrace Unit 112
- 4251 Jacinto Dr
- 35782 Augustine Ct
- 35776 Augustine Ct
- 35784 Augustine Ct
- 35773 Augustine Place
- 35800 Augustine Place
- 35783 Augustine Place
- 35763 Augustine Place
- 35724 Augustine Place
- 35785 Augustine Ct
- 35801 Augustine Place
- 35786 Augustine Ct
- 35802 Augustine Place
- 35787 Augustine Ct
- 35748 Gissing Place
- 35803 Augustine Place
- 35754 Gissing Place
- 35788 Augustine Ct
- 35806 Augustine Place
- 35760 Gissing Place
- 35710 Gissing Place
Your Personal Tour Guide
Ask me questions while you tour the home.