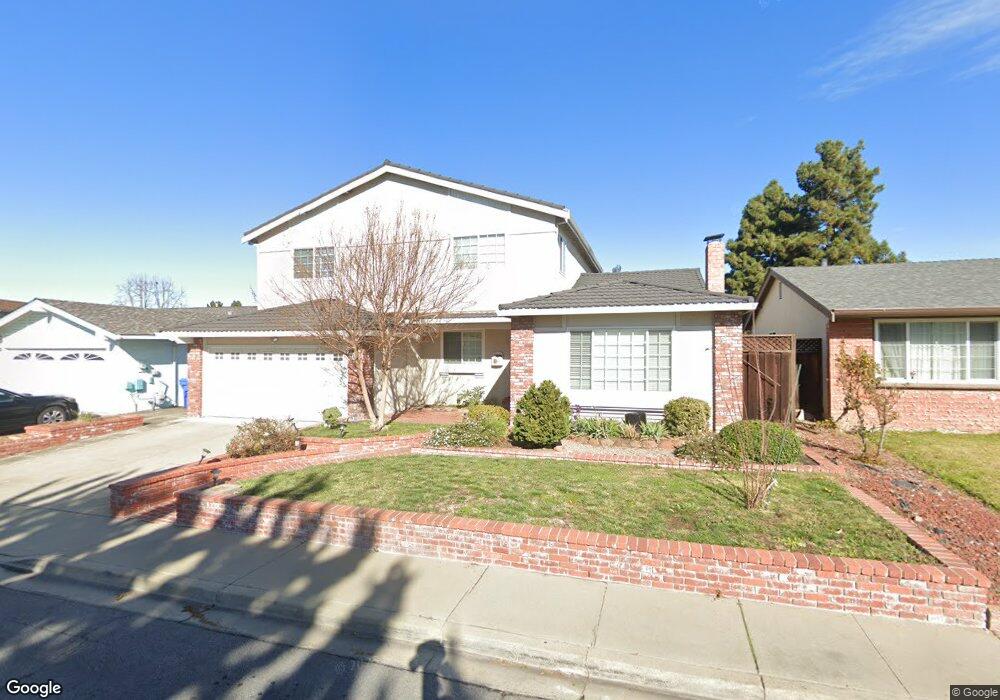
35782 Augustine Ct Fremont, CA 94536
Brookvale NeighborhoodEstimated Value: $2,000,000 - $2,306,000
5
Beds
3
Baths
3,039
Sq Ft
$715/Sq Ft
Est. Value
About This Home
This home is located at 35782 Augustine Ct, Fremont, CA 94536 and is currently estimated at $2,173,749, approximately $715 per square foot. 35782 Augustine Ct is a home located in Alameda County with nearby schools including Brookvale Elementary School, Thornton Middle School, and American High School.
Ownership History
Date
Name
Owned For
Owner Type
Purchase Details
Closed on
Mar 22, 2016
Sold by
Hong Sung Hyun and Oh Book Kyoung Hong
Bought by
Chen Mike Y and Yu Erica A
Current Estimated Value
Home Financials for this Owner
Home Financials are based on the most recent Mortgage that was taken out on this home.
Original Mortgage
$1,000,000
Outstanding Balance
$767,010
Interest Rate
2.75%
Mortgage Type
Adjustable Rate Mortgage/ARM
Estimated Equity
$1,406,739
Purchase Details
Closed on
May 17, 2007
Sold by
Villagran Marc S and Villagran Erlinda A
Bought by
Hong Sung Hyun and Oh Sook Kyoung Hong
Home Financials for this Owner
Home Financials are based on the most recent Mortgage that was taken out on this home.
Original Mortgage
$670,000
Interest Rate
6%
Mortgage Type
Purchase Money Mortgage
Purchase Details
Closed on
Aug 26, 2002
Sold by
Fowlie John G and Fowlie Jane A
Bought by
Villagran Marc S and Villagran Erlinda A
Home Financials for this Owner
Home Financials are based on the most recent Mortgage that was taken out on this home.
Original Mortgage
$300,700
Interest Rate
6.16%
Purchase Details
Closed on
Nov 29, 1999
Sold by
Fowlie John G and Fowlie Jane A
Bought by
Fowlie John G and Fowlie Jane A
Create a Home Valuation Report for This Property
The Home Valuation Report is an in-depth analysis detailing your home's value as well as a comparison with similar homes in the area
Home Values in the Area
Average Home Value in this Area
Purchase History
| Date | Buyer | Sale Price | Title Company |
|---|---|---|---|
| Chen Mike Y | $1,250,000 | Fidelity National Title Co | |
| Hong Sung Hyun | $870,000 | Chicago Title Co | |
| Villagran Marc S | $460,000 | Fidelity National Title Co | |
| Fowlie John G | -- | -- |
Source: Public Records
Mortgage History
| Date | Status | Borrower | Loan Amount |
|---|---|---|---|
| Open | Chen Mike Y | $1,000,000 | |
| Previous Owner | Hong Sung Hyun | $670,000 | |
| Previous Owner | Villagran Marc S | $300,700 | |
| Closed | Villagran Marc S | $75,300 |
Source: Public Records
Tax History
| Year | Tax Paid | Tax Assessment Tax Assessment Total Assessment is a certain percentage of the fair market value that is determined by local assessors to be the total taxable value of land and additions on the property. | Land | Improvement |
|---|---|---|---|---|
| 2025 | $17,175 | $1,472,711 | $556,371 | $923,340 |
| 2024 | $17,175 | $1,443,699 | $545,463 | $905,236 |
| 2023 | $16,731 | $1,422,261 | $534,770 | $887,491 |
| 2022 | $16,538 | $1,387,375 | $524,285 | $870,090 |
| 2021 | $16,125 | $1,360,037 | $514,006 | $853,031 |
| 2020 | $16,250 | $1,353,024 | $508,737 | $844,287 |
| 2019 | $16,060 | $1,326,500 | $498,764 | $827,736 |
| 2018 | $15,749 | $1,300,500 | $488,988 | $811,512 |
| 2017 | $15,354 | $1,275,000 | $479,400 | $795,600 |
| 2016 | $12,001 | $984,604 | $295,381 | $689,223 |
| 2015 | $11,848 | $969,823 | $290,947 | $678,876 |
| 2014 | $10,295 | $836,000 | $250,800 | $585,200 |
Source: Public Records
Map
Nearby Homes
- 2896 Harrisburg Ave
- 35037 Begonia St
- 35429 Galen Place
- 35234 Cornish Dr
- 36500 Alder Ct
- 34839 Clover St
- 3433 Surry Place
- 3184 Waugh Place
- 34803 Hollyhock St
- 34819 Clover St
- 2921 Daisy Ct
- 2903 Begonia St
- 2102 Farrol Ave
- 35039 Peco St
- 2655 Barrington Terrace
- 36957 Reynolds Dr
- 34926 Moina Shaiq Common
- 36640 Oak St
- 3371 Baywood Terrace Unit 112
- 4251 Jacinto Dr
- 35784 Augustine Ct
- 35778 Augustine Ct
- 35776 Augustine Ct
- 35786 Augustine Ct
- 35800 Augustine Place
- 35785 Augustine Ct
- 35724 Augustine Place
- 35773 Augustine Place
- 35788 Augustine Ct
- 35787 Augustine Ct
- 35802 Augustine Place
- 35783 Augustine Place
- 35763 Augustine Place
- 35801 Augustine Place
- 35790 Augustine Ct
- 35789 Augustine Ct
- 35806 Augustine Place
- 35803 Augustine Place
- 35818 Augustine Place
- 35748 Gissing Place
Your Personal Tour Guide
Ask me questions while you tour the home.