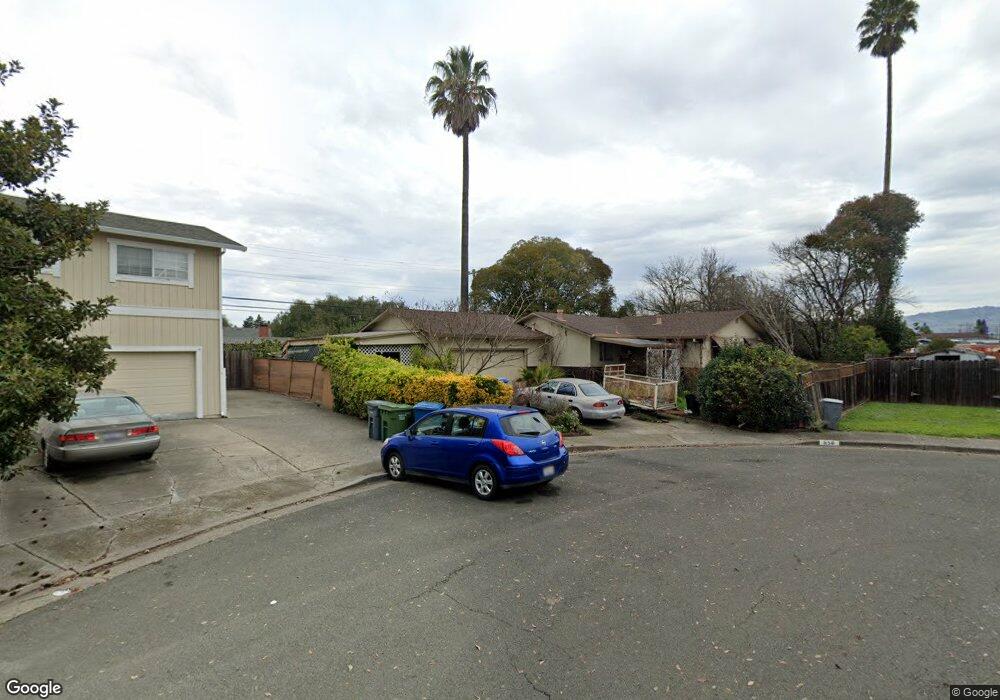
358 Adele Ave Rohnert Park, CA 94928
Estimated Value: $459,000 - $660,000
3
Beds
2
Baths
1,080
Sq Ft
$518/Sq Ft
Est. Value
About This Home
This home is located at 358 Adele Ave, Rohnert Park, CA 94928 and is currently estimated at $559,154, approximately $517 per square foot. 358 Adele Ave is a home located in Sonoma County with nearby schools including Rancho Cotate High School, Cross & Crown Lutheran School, and Bridghaven.
Ownership History
Date
Name
Owned For
Owner Type
Purchase Details
Closed on
Jun 18, 2024
Sold by
Napoli Kerri M
Bought by
Napoli Kerri M and Boschen John
Current Estimated Value
Home Financials for this Owner
Home Financials are based on the most recent Mortgage that was taken out on this home.
Original Mortgage
$455,000
Outstanding Balance
$449,271
Interest Rate
7.09%
Mortgage Type
New Conventional
Estimated Equity
$109,883
Purchase Details
Closed on
May 20, 2024
Sold by
Violet A Napoli Revocable Trust and Napoli Kerri M
Bought by
Napoli Kerri M
Home Financials for this Owner
Home Financials are based on the most recent Mortgage that was taken out on this home.
Original Mortgage
$455,000
Outstanding Balance
$449,271
Interest Rate
7.09%
Mortgage Type
New Conventional
Estimated Equity
$109,883
Purchase Details
Closed on
Oct 30, 2017
Sold by
Napoli Violet A
Bought by
Napoli Violet A and Violet A Napoli Revocable Trus
Create a Home Valuation Report for This Property
The Home Valuation Report is an in-depth analysis detailing your home's value as well as a comparison with similar homes in the area
Home Values in the Area
Average Home Value in this Area
Purchase History
| Date | Buyer | Sale Price | Title Company |
|---|---|---|---|
| Napoli Kerri M | $227,500 | Old Republic Title | |
| Napoli Kerri M | -- | None Listed On Document | |
| Napoli Violet A | -- | None Available |
Source: Public Records
Mortgage History
| Date | Status | Borrower | Loan Amount |
|---|---|---|---|
| Open | Napoli Kerri M | $455,000 |
Source: Public Records
Tax History Compared to Growth
Tax History
| Year | Tax Paid | Tax Assessment Tax Assessment Total Assessment is a certain percentage of the fair market value that is determined by local assessors to be the total taxable value of land and additions on the property. | Land | Improvement |
|---|---|---|---|---|
| 2025 | $801 | $65,412 | $20,077 | $45,335 |
| 2024 | $801 | $64,131 | $19,684 | $44,447 |
| 2023 | $801 | $62,875 | $19,299 | $43,576 |
| 2022 | $783 | $61,643 | $18,921 | $42,722 |
| 2021 | $775 | $60,435 | $18,550 | $41,885 |
| 2020 | $783 | $59,816 | $18,360 | $41,456 |
| 2019 | $772 | $58,644 | $18,000 | $40,644 |
| 2018 | $757 | $57,496 | $17,648 | $39,848 |
| 2017 | $744 | $56,369 | $17,302 | $39,067 |
| 2016 | $706 | $55,264 | $16,963 | $38,301 |
| 2015 | $690 | $54,435 | $16,709 | $37,726 |
| 2014 | $683 | $53,369 | $16,382 | $36,987 |
Source: Public Records
Map
Nearby Homes
- 220 Arlen Dr
- 950 Santa Alicia Dr
- 522 Santa Alicia Dr
- 566 Santa Alicia Dr
- 21 Avram Ave
- 11 Avram Ave
- 7517 Bobbie Way
- 105 Nicholas Ct
- 7301 Willlowglen Dr
- 101 Pinewood Ct
- 7236 Cadiz Ct
- 233 Apple Ln
- 359 Bonnie Ave
- 211 Apple Ln
- 55 Alfaro Ct
- 58 Estrella Dr
- 6440 Country Club Dr
- 318 City Center Dr
- 79 William St Unit B
- 7459 Alder Ave