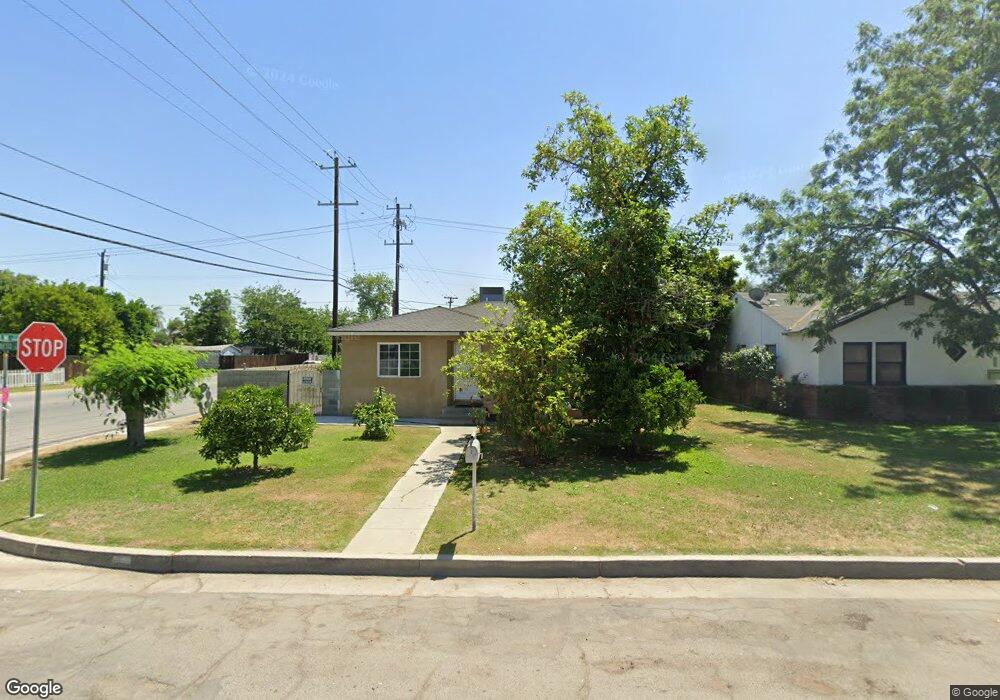
358 Cypress St Bakersfield, CA 93304
Oleander-Sunset NeighborhoodEstimated Value: $282,000 - $353,000
4
Beds
1
Bath
1,170
Sq Ft
$274/Sq Ft
Est. Value
About This Home
This home is located at 358 Cypress St, Bakersfield, CA 93304 and is currently estimated at $320,142, approximately $273 per square foot. 358 Cypress St is a home located in Kern County with nearby schools including Roosevelt Elementary School, Emerson Middle School, and Bakersfield High School.
Ownership History
Date
Name
Owned For
Owner Type
Purchase Details
Closed on
Aug 19, 1999
Sold by
Hieronymus Cheryl
Bought by
Cabrera Carlos I and Cabrera Violeta Villa
Current Estimated Value
Home Financials for this Owner
Home Financials are based on the most recent Mortgage that was taken out on this home.
Original Mortgage
$67,894
Outstanding Balance
$20,182
Interest Rate
8.09%
Mortgage Type
FHA
Estimated Equity
$299,960
Create a Home Valuation Report for This Property
The Home Valuation Report is an in-depth analysis detailing your home's value as well as a comparison with similar homes in the area
Home Values in the Area
Average Home Value in this Area
Purchase History
| Date | Buyer | Sale Price | Title Company |
|---|---|---|---|
| Cabrera Carlos I | $68,000 | First American Title Co |
Source: Public Records
Mortgage History
| Date | Status | Borrower | Loan Amount |
|---|---|---|---|
| Open | Cabrera Carlos I | $67,894 | |
| Closed | Cabrera Carlos I | $3,400 |
Source: Public Records
Tax History Compared to Growth
Tax History
| Year | Tax Paid | Tax Assessment Tax Assessment Total Assessment is a certain percentage of the fair market value that is determined by local assessors to be the total taxable value of land and additions on the property. | Land | Improvement |
|---|---|---|---|---|
| 2025 | $2,627 | $127,660 | $27,650 | $100,010 |
| 2024 | $2,558 | $125,158 | $27,108 | $98,050 |
| 2023 | $2,558 | $122,705 | $26,577 | $96,128 |
| 2022 | $2,473 | $120,300 | $26,056 | $94,244 |
| 2021 | $2,285 | $117,943 | $25,546 | $92,397 |
| 2020 | $2,218 | $116,736 | $25,285 | $91,451 |
| 2019 | $2,174 | $116,736 | $25,285 | $91,451 |
| 2018 | $2,127 | $112,206 | $24,304 | $87,902 |
| 2017 | $2,109 | $110,007 | $23,828 | $86,179 |
| 2016 | $1,972 | $107,851 | $23,361 | $84,490 |
| 2015 | $1,952 | $106,232 | $23,011 | $83,221 |
| 2014 | $1,889 | $104,153 | $22,561 | $81,592 |
Source: Public Records
Map
Nearby Homes