
Seller's Agent in 2025
Zach Dilworth
Serenity Realty LLC
(419) 340-9493
10 in this area
222 Total Sales
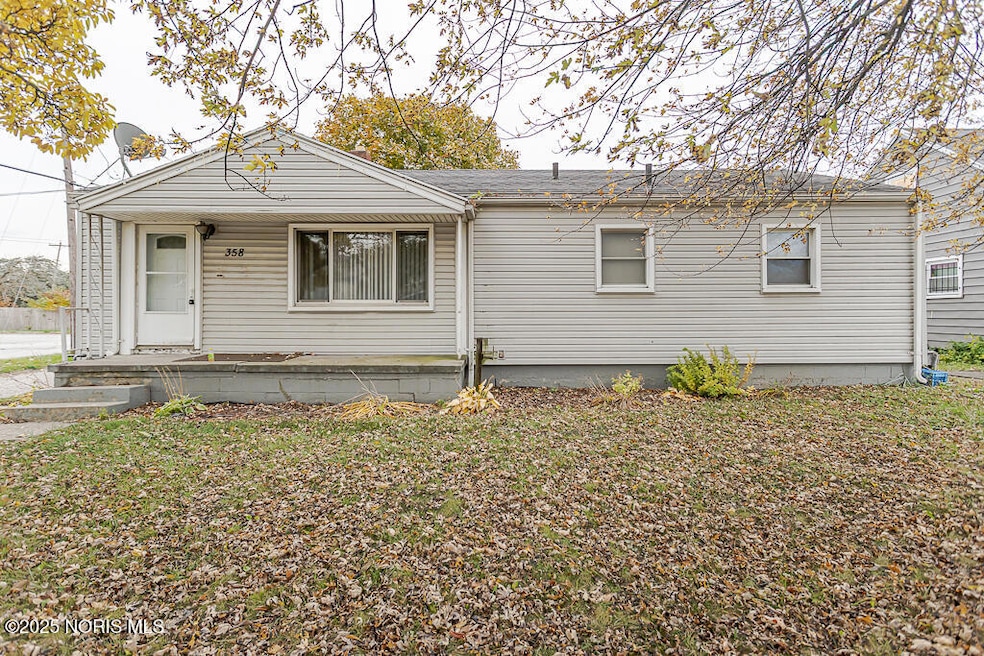
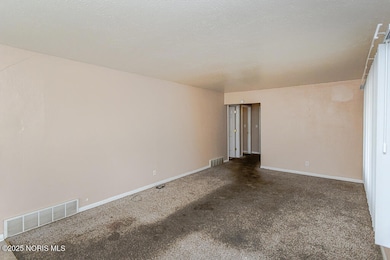
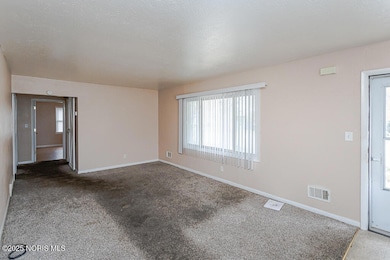
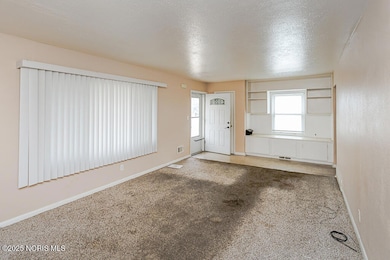
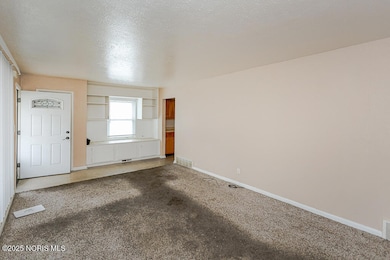
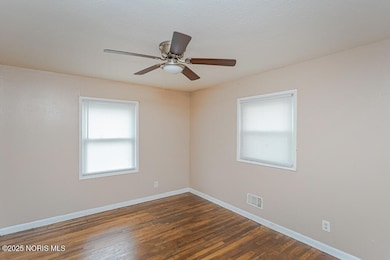
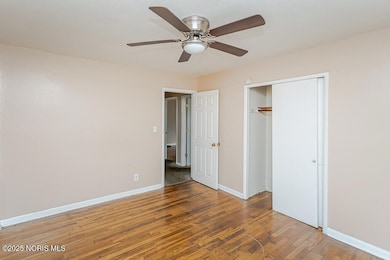
Multiple Offers Received. The attorney in charge of the estate has requested that Highest & Best Offers be submitted no later then Monday 11/17/25 by 10AM. The offers will be reviewed and responded to by Tuesday 11/18/25 by 2PM. This 3 Bedroom One-Story Home is ideal for anyone! Whether you are looking to move in yourself or add to your rental portfolio this property is ready! This home features a great layout and has a large basement! Schedule today!
Last Agent to Sell the Property
Serenity Realty LLC Brokerage Phone: 419-340-9493 License #2011003130 Listed on: 11/10/2025
| Date | Type | Sale Price | Title Company |
|---|---|---|---|
| Fiduciary Deed | $163,000 | None Listed On Document | |
| Warranty Deed | $163,000 | None Listed On Document | |
| Sheriffs Deed | $10,025 | None Available | |
| Deed | $10,025 | None Available | |
| Deed | $29,000 | Lakeside Title & Escrow Agen | |
| Sheriffs Deed | $40,000 | -- | |
| Warranty Deed | $64,800 | Northwest Title Agency Of Oh |
| Date | Status | Loan Amount | Loan Type |
|---|---|---|---|
| Previous Owner | $64,724 | FHA |
| Date | Event | Price | List to Sale | Price per Sq Ft |
|---|---|---|---|---|
| 12/29/2025 12/29/25 | Sold | $65,000 | 0.0% | $63 / Sq Ft |
| 11/10/2025 11/10/25 | For Sale | $65,000 | -- | $63 / Sq Ft |
| Year | Tax Paid | Tax Assessment Tax Assessment Total Assessment is a certain percentage of the fair market value that is determined by local assessors to be the total taxable value of land and additions on the property. | Land | Improvement |
|---|---|---|---|---|
| 2025 | $1,092 | $15,680 | $5,740 | $9,940 |
| 2024 | $1,079 | $15,680 | $5,740 | $9,940 |
| 2023 | $1,458 | $16,940 | $2,800 | $14,140 |
| 2022 | $1,432 | $16,940 | $2,800 | $14,140 |
| 2021 | $1,364 | $16,940 | $2,800 | $14,140 |
| 2020 | $1,530 | $16,450 | $2,695 | $13,755 |
| 2019 | $1,482 | $16,450 | $2,695 | $13,755 |
| 2018 | $1,415 | $16,450 | $2,695 | $13,755 |
| 2017 | $1,563 | $16,065 | $2,625 | $13,440 |
| 2016 | $3,129 | $45,900 | $7,500 | $38,400 |
| 2015 | $1,374 | $45,900 | $7,500 | $38,400 |
| 2014 | $1,234 | $16,070 | $2,630 | $13,440 |
| 2013 | $1,039 | $16,070 | $2,630 | $13,440 |
Seller's Agent in 2025
Zach Dilworth
Serenity Realty LLC
(419) 340-9493
10 in this area
222 Total Sales
J
Buyer's Agent in 2025
Jackson Strong
Serenity Realty LLC
(419) 266-5911
6 in this area
42 Total Sales
Source: Northwest Ohio Real Estate Information Service (NORIS)
MLS Number: 10001295
APN: 10-25614
Disclaimer: Certain information contained herein is derived from information provided by parties other than Homes.com. All information provided is deemed reliable, but is not guaranteed to be accurate and should be independently verified.
![]() IDX information is provided exclusively for personal, non-commercial use, and may not be used for any purpose other than to identify prospective properties consumers may be interested in purchasing. Information is deemed reliable but not guaranteed. ©2026 NORIS. All rights reserved.
IDX information is provided exclusively for personal, non-commercial use, and may not be used for any purpose other than to identify prospective properties consumers may be interested in purchasing. Information is deemed reliable but not guaranteed. ©2026 NORIS. All rights reserved.
Ask me questions while you tour the home.