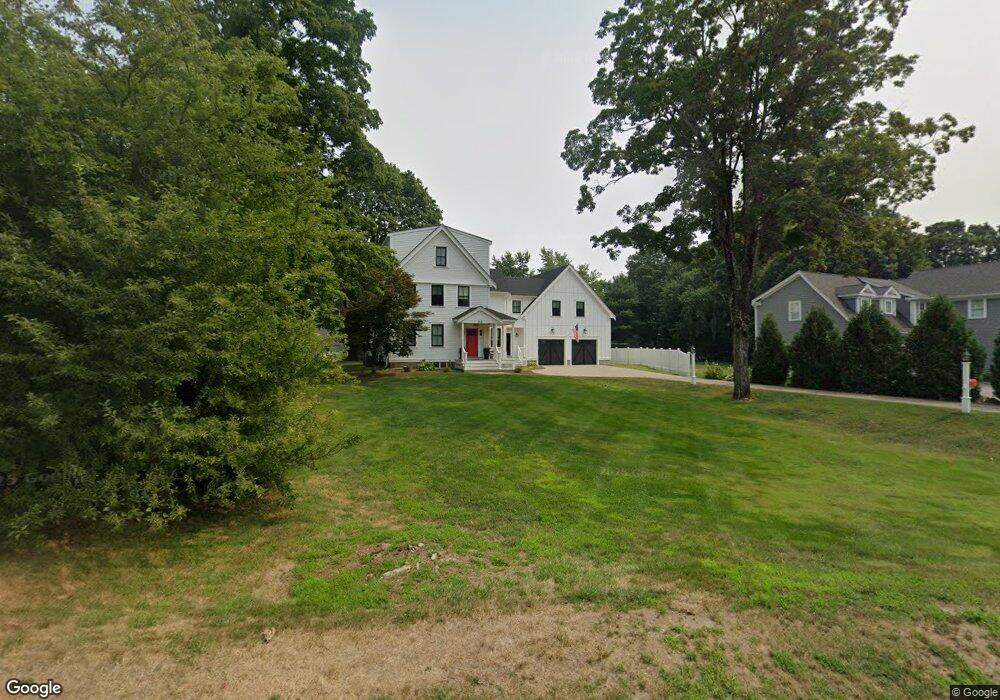
358 Main St Medfield, MA 02052
Estimated Value: $1,171,000 - $1,630,000
4
Beds
2
Baths
2,624
Sq Ft
$541/Sq Ft
Est. Value
About This Home
This home is located at 358 Main St, Medfield, MA 02052 and is currently estimated at $1,420,855, approximately $541 per square foot. 358 Main St is a home located in Norfolk County with nearby schools including Memorial School, Ralph Wheelock School, and Dale Street School.
Ownership History
Date
Name
Owned For
Owner Type
Purchase Details
Closed on
Aug 30, 2016
Sold by
Ams Development Group
Bought by
Perkins John E
Current Estimated Value
Purchase Details
Closed on
Oct 8, 2015
Sold by
Siino Suzanne and Perkins John
Bought by
Ams Development Group
Purchase Details
Closed on
Sep 10, 2015
Sold by
Gillis Mary V
Bought by
Siino Suzanne and Perkins John
Create a Home Valuation Report for This Property
The Home Valuation Report is an in-depth analysis detailing your home's value as well as a comparison with similar homes in the area
Home Values in the Area
Average Home Value in this Area
Purchase History
| Date | Buyer | Sale Price | Title Company |
|---|---|---|---|
| Perkins John E | -- | -- | |
| Perkins John E | -- | -- | |
| Ams Development Group | -- | -- | |
| Ams Development Group | -- | -- | |
| Siino Suzanne | $505,000 | -- | |
| Siino Suzanne | $505,000 | -- |
Source: Public Records
Tax History Compared to Growth
Tax History
| Year | Tax Paid | Tax Assessment Tax Assessment Total Assessment is a certain percentage of the fair market value that is determined by local assessors to be the total taxable value of land and additions on the property. | Land | Improvement |
|---|---|---|---|---|
| 2025 | $17,537 | $1,270,800 | $383,400 | $887,400 |
| 2024 | $17,274 | $1,179,900 | $355,300 | $824,600 |
| 2023 | $16,794 | $1,088,400 | $336,600 | $751,800 |
| 2022 | $16,361 | $939,200 | $317,900 | $621,300 |
| 2021 | $8,761 | $493,300 | $308,600 | $184,700 |
| 2020 | $7,517 | $421,600 | $301,100 | $120,500 |
| 2019 | $7,286 | $407,700 | $289,900 | $117,800 |
| 2018 | $6,580 | $386,400 | $271,200 | $115,200 |
| 2017 | $6,368 | $377,000 | $261,800 | $115,200 |
| 2016 | $7,290 | $435,200 | $285,600 | $149,600 |
| 2015 | $6,867 | $428,100 | $279,400 | $148,700 |
| 2014 | $6,643 | $412,100 | $263,400 | $148,700 |
Source: Public Records
Map
Nearby Homes
- 435 Main St Unit B
- 431 Main St Unit 5
- 21 Philip St
- 15 Belknap Rd
- 34 Frairy St
- 46 Frairy St
- 8 Turtlebrook Way
- 21 Winter St
- 3 Hennery Way Bld E Unit 3
- 14 Harding St
- 94 Elm St
- 3 Shining Valley Cir
- 111 Elm St
- 80 West St
- 75 Bridge St
- 270 South St
- 44 Millbrook Ave
- 17 Bridle Path
- 11 Garry Dr
- 18 Tisdale Dr Unit 18