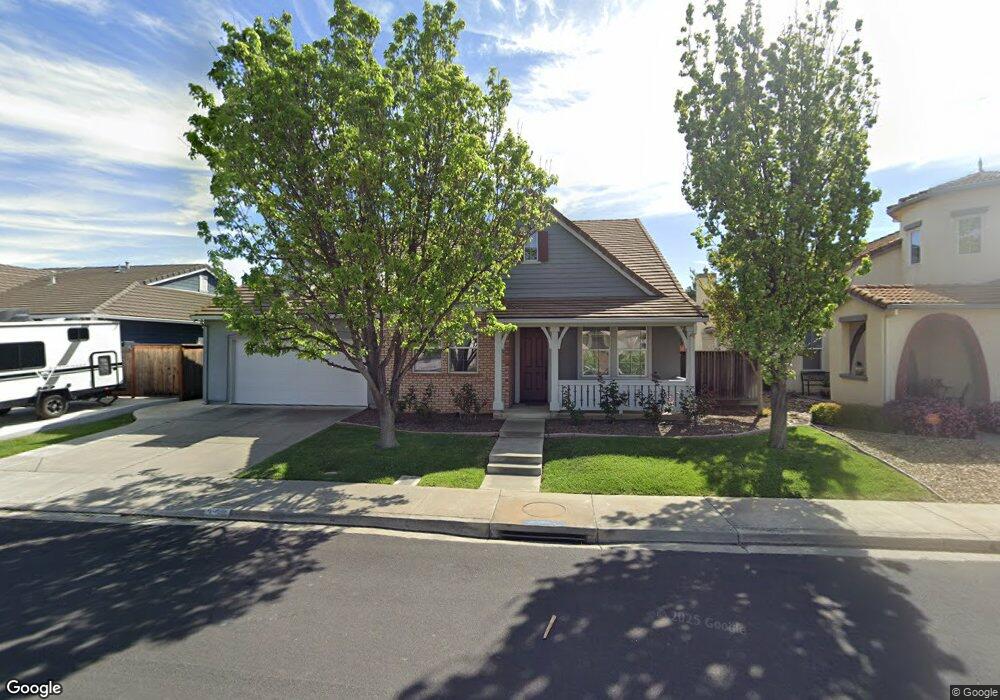
358 Sage Sparrow Cir Vacaville, CA 95687
Estimated Value: $812,320 - $852,000
5
Beds
4
Baths
3,132
Sq Ft
$266/Sq Ft
Est. Value
About This Home
This home is located at 358 Sage Sparrow Cir, Vacaville, CA 95687 and is currently estimated at $831,830, approximately $265 per square foot. 358 Sage Sparrow Cir is a home located in Solano County with nearby schools including Cambridge Elementary School, Golden West Middle School, and Vanden High School.
Ownership History
Date
Name
Owned For
Owner Type
Purchase Details
Closed on
Oct 15, 2015
Sold by
Ford John T and Ford Betty Jean
Bought by
Ford John T and Ford Betty Jean
Current Estimated Value
Home Financials for this Owner
Home Financials are based on the most recent Mortgage that was taken out on this home.
Original Mortgage
$310,160
Outstanding Balance
$185,783
Interest Rate
3.85%
Mortgage Type
New Conventional
Estimated Equity
$646,047
Purchase Details
Closed on
Nov 25, 2008
Sold by
Ford John T and Ford Betty Jean
Bought by
Ford John T and Ford Betty Jean
Purchase Details
Closed on
Jul 23, 2004
Sold by
Standard Pacific Of Northern California
Bought by
Ford John T and Ford Betty J
Home Financials for this Owner
Home Financials are based on the most recent Mortgage that was taken out on this home.
Original Mortgage
$462,940
Interest Rate
4.87%
Mortgage Type
New Conventional
Create a Home Valuation Report for This Property
The Home Valuation Report is an in-depth analysis detailing your home's value as well as a comparison with similar homes in the area
Home Values in the Area
Average Home Value in this Area
Purchase History
| Date | Buyer | Sale Price | Title Company |
|---|---|---|---|
| Ford John T | -- | Entitle Insurance Company | |
| Ford John T | -- | None Available | |
| Ford John T | $579,000 | Chicago Title Co |
Source: Public Records
Mortgage History
| Date | Status | Borrower | Loan Amount |
|---|---|---|---|
| Open | Ford John T | $310,160 | |
| Previous Owner | Ford John T | $462,940 | |
| Closed | Ford John T | $57,865 |
Source: Public Records
Tax History Compared to Growth
Tax History
| Year | Tax Paid | Tax Assessment Tax Assessment Total Assessment is a certain percentage of the fair market value that is determined by local assessors to be the total taxable value of land and additions on the property. | Land | Improvement |
|---|---|---|---|---|
| 2025 | $8,641 | $763,000 | $152,000 | $611,000 |
| 2024 | $8,641 | $763,000 | $152,000 | $611,000 |
| 2023 | $8,681 | $763,000 | $152,000 | $611,000 |
| 2022 | $8,699 | $763,000 | $152,000 | $611,000 |
| 2021 | $7,797 | $685,560 | $143,000 | $542,560 |
| 2020 | $6,708 | $591,000 | $130,000 | $461,000 |
| 2019 | $6,654 | $591,000 | $130,000 | $461,000 |
| 2018 | $6,506 | $577,000 | $132,000 | $445,000 |
| 2017 | $6,005 | $540,000 | $129,000 | $411,000 |
| 2016 | $5,890 | $526,000 | $131,000 | $395,000 |
| 2015 | $5,808 | $518,000 | $130,000 | $388,000 |
| 2014 | $5,117 | $454,000 | $114,000 | $340,000 |
Source: Public Records
Map
Nearby Homes
- 660 Sparrowhawk Dr
- 630 Purple Martin Dr
- 472 Harvest Cir
- 723 Chateau Cir
- 357 Colonial Cir
- 136 Brockton Ct
- 854 Owl Cir
- 8000 Carpenter Ct
- 360 Baler Cir
- 236 Cogburn Way
- 232 Riverdale Ave
- 4054 Camden Ct
- 804 Engineer Cir
- 106 Village Ct
- 810 Engineer Cir
- 190 Fairview Dr
- 822 Engineer Cir
- 846 Engineer Cir
- 331 Baler Cir
- 330 Baler Cir
- 364 Sage Sparrow Cir
- 352 Sage Sparrow Cir
- 2024 Wild Rose Ct
- 2018 Wild Rose Ct
- 370 Sage Sparrow Cir
- 346 Sage Sparrow Cir
- 406 Royal Tern Dr
- 347 Sage Sparrow Cir
- 412 Royal Tern Dr
- 2012 Wild Rose Ct
- 607 Sparrowhawk Dr
- 601 Sparrowhawk Dr
- 371 Sage Sparrow Cir
- 613 Sparrowhawk Dr
- 619 Sparrowhawk Dr
- 335 Sage Sparrow Cir
- 407 Royal Tern Dr
- 2006 Wild Rose Ct