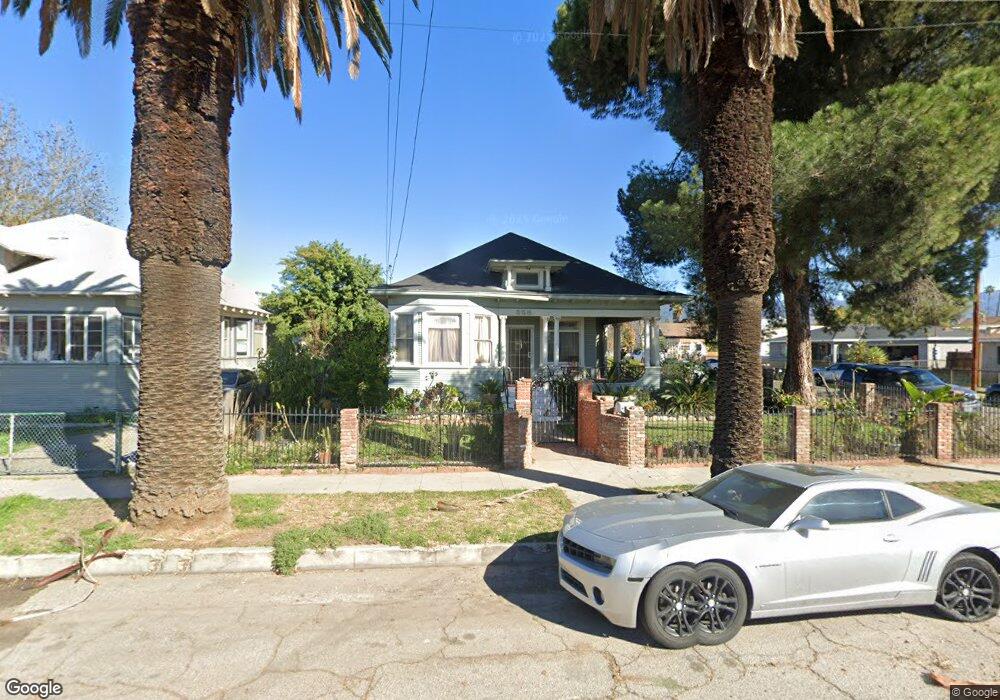
358 W 8th St San Bernardino, CA 92401
Civic Center NeighborhoodEstimated Value: $425,000 - $508,000
3
Beds
2
Baths
1,434
Sq Ft
$320/Sq Ft
Est. Value
About This Home
This home is located at 358 W 8th St, San Bernardino, CA 92401 and is currently estimated at $459,385, approximately $320 per square foot. 358 W 8th St is a home located in San Bernardino County with nearby schools including Captain Leland Norton Elementary School, Arrowview Middle School, and Indian Springs High.
Ownership History
Date
Name
Owned For
Owner Type
Purchase Details
Closed on
Nov 10, 2011
Sold by
Contreras Maria
Bought by
Contreras Genaro
Current Estimated Value
Purchase Details
Closed on
May 25, 2008
Sold by
Deutsche Bank Trust Co Americas
Bought by
Contreras Maria
Purchase Details
Closed on
Nov 20, 2007
Sold by
Lomeli Star
Bought by
Deutsche Bank Trust Co Americas and Morgan Stanley Home Equity Loan Trust Ms
Purchase Details
Closed on
Jan 9, 2003
Sold by
Deaton Meredith
Bought by
Lomeli Star
Home Financials for this Owner
Home Financials are based on the most recent Mortgage that was taken out on this home.
Original Mortgage
$113,223
Interest Rate
5.85%
Mortgage Type
FHA
Purchase Details
Closed on
Nov 11, 2001
Sold by
Beltran William R and Beltran Rosemary
Bought by
Deaton Meredith
Home Financials for this Owner
Home Financials are based on the most recent Mortgage that was taken out on this home.
Original Mortgage
$82,702
Interest Rate
6.8%
Mortgage Type
FHA
Create a Home Valuation Report for This Property
The Home Valuation Report is an in-depth analysis detailing your home's value as well as a comparison with similar homes in the area
Home Values in the Area
Average Home Value in this Area
Purchase History
| Date | Buyer | Sale Price | Title Company |
|---|---|---|---|
| Contreras Genaro | -- | None Available | |
| Contreras Maria | $100,000 | First American Title Ins Co | |
| Deutsche Bank Trust Co Americas | $190,400 | None Available | |
| Lomeli Star | $115,000 | Commonwealth Title | |
| Deaton Meredith | $84,000 | Commerce Title |
Source: Public Records
Mortgage History
| Date | Status | Borrower | Loan Amount |
|---|---|---|---|
| Previous Owner | Lomeli Star | $113,223 | |
| Previous Owner | Deaton Meredith | $82,702 |
Source: Public Records
Tax History Compared to Growth
Tax History
| Year | Tax Paid | Tax Assessment Tax Assessment Total Assessment is a certain percentage of the fair market value that is determined by local assessors to be the total taxable value of land and additions on the property. | Land | Improvement |
|---|---|---|---|---|
| 2025 | $1,196 | $90,437 | $27,634 | $62,803 |
| 2024 | $1,196 | $88,664 | $27,092 | $61,572 |
| 2023 | $1,164 | $86,926 | $26,561 | $60,365 |
| 2022 | $1,160 | $85,221 | $26,040 | $59,181 |
| 2021 | $1,157 | $83,550 | $25,529 | $58,021 |
| 2020 | $1,155 | $82,693 | $25,267 | $57,426 |
| 2019 | $1,123 | $81,072 | $24,772 | $56,300 |
| 2018 | $1,110 | $79,482 | $24,286 | $55,196 |
| 2017 | $1,074 | $77,924 | $23,810 | $54,114 |
| 2016 | $1,040 | $76,396 | $23,343 | $53,053 |
| 2015 | $907 | $75,248 | $22,992 | $52,256 |
| 2014 | $880 | $73,774 | $22,542 | $51,232 |
Source: Public Records
Map
Nearby Homes
- 928 N Arrowhead Ave
- 840 N E St
- 869 N F St
- 325 W 6th St
- 591 W 9th St
- 1001 N Mountain View Ave
- 940 N Sierra Way
- 958 N Sierra Way
- 119 E 9th St
- 596 W 6th St
- 290 W 11th St
- 901 N F St
- 1137 N Mayfield Ave
- 0 Kramer Juntion Unit /46 250031305
- 149 W 6th St Unit 42
- 149 W 6th St Unit 8
- 1064 Acacia Ave
- 859 N G St
- 170 W 11th St
- 708 W 9th St
- 362 W 8th St
- 828 N Mayfield Ave
- 348 W 8th St
- 832 N Mayfield Ave
- 813 N D St Unit 4
- 813 N D St Unit 1
- 829 N Mayfield Ave
- 359 W 8th St Unit F
- 359 W 8th St
- 827 N D St
- 844 N Mayfield Ave
- 835 N Mayfield Ave
- 845 N Mayfield Ave
- 814 N Arrowhead Ave
- 854 N Mayfield Ave
- 808 N Arrowhead Ave
- 381 W 8th St
- 857 N Mayfield Ave
- 789 N D St
- 343 W 8th St