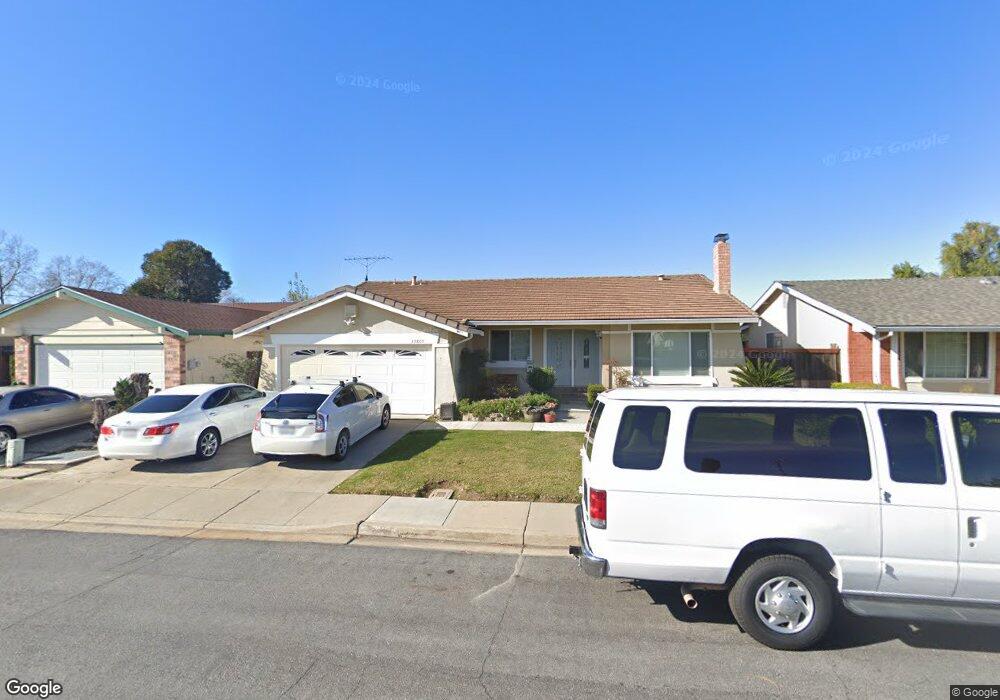
35805 Augustine Place Fremont, CA 94536
Brookvale NeighborhoodEstimated Value: $1,766,000 - $1,892,000
4
Beds
2
Baths
1,830
Sq Ft
$1,000/Sq Ft
Est. Value
About This Home
This home is located at 35805 Augustine Place, Fremont, CA 94536 and is currently estimated at $1,830,043, approximately $1,000 per square foot. 35805 Augustine Place is a home located in Alameda County with nearby schools including Brookvale Elementary School, Thornton Middle School, and American High School.
Ownership History
Date
Name
Owned For
Owner Type
Purchase Details
Closed on
May 29, 2015
Sold by
Tahk Tom Jh
Bought by
Tahk Tom Jh and Tahk Kyung A
Current Estimated Value
Home Financials for this Owner
Home Financials are based on the most recent Mortgage that was taken out on this home.
Original Mortgage
$535,000
Outstanding Balance
$412,440
Interest Rate
3.62%
Mortgage Type
New Conventional
Estimated Equity
$1,417,603
Purchase Details
Closed on
Feb 18, 2005
Sold by
Tahk Kyung A
Bought by
Tahk Tom Jh
Home Financials for this Owner
Home Financials are based on the most recent Mortgage that was taken out on this home.
Original Mortgage
$544,000
Interest Rate
5%
Mortgage Type
Purchase Money Mortgage
Purchase Details
Closed on
Feb 11, 2005
Sold by
Yu Ann Yun
Bought by
Tahk Tom Jh
Home Financials for this Owner
Home Financials are based on the most recent Mortgage that was taken out on this home.
Original Mortgage
$544,000
Interest Rate
5%
Mortgage Type
Purchase Money Mortgage
Create a Home Valuation Report for This Property
The Home Valuation Report is an in-depth analysis detailing your home's value as well as a comparison with similar homes in the area
Home Values in the Area
Average Home Value in this Area
Purchase History
| Date | Buyer | Sale Price | Title Company |
|---|---|---|---|
| Tahk Tom Jh | -- | Placer Title Company | |
| Tahk Tom Jh | -- | Fidelity National Title Co | |
| Tahk Tom Jh | $680,000 | Fidelity National Title Co |
Source: Public Records
Mortgage History
| Date | Status | Borrower | Loan Amount |
|---|---|---|---|
| Open | Tahk Tom Jh | $535,000 | |
| Closed | Tahk Tom Jh | $544,000 | |
| Closed | Tahk Tom Jh | $544,000 |
Source: Public Records
Tax History Compared to Growth
Tax History
| Year | Tax Paid | Tax Assessment Tax Assessment Total Assessment is a certain percentage of the fair market value that is determined by local assessors to be the total taxable value of land and additions on the property. | Land | Improvement |
|---|---|---|---|---|
| 2025 | $11,347 | $947,770 | $284,331 | $663,439 |
| 2024 | $11,347 | $929,191 | $278,757 | $650,434 |
| 2023 | $11,046 | $910,974 | $273,292 | $637,682 |
| 2022 | $10,909 | $893,118 | $267,935 | $625,183 |
| 2021 | $10,641 | $875,608 | $262,682 | $612,926 |
| 2020 | $10,684 | $866,631 | $259,989 | $606,642 |
| 2019 | $10,563 | $849,645 | $254,893 | $594,752 |
| 2018 | $10,358 | $832,992 | $249,897 | $583,095 |
| 2017 | $10,100 | $816,665 | $244,999 | $571,666 |
| 2016 | $9,932 | $800,658 | $240,197 | $560,461 |
| 2015 | $9,803 | $788,636 | $236,591 | $552,045 |
| 2014 | $9,352 | $749,000 | $224,700 | $524,300 |
Source: Public Records
Map
Nearby Homes
- 3155 Mackenzie Place
- 35415 Woodbridge Place
- 3184 Waugh Place
- 3751 Ruskin Place
- 4027 Sunset Terrace
- 34926 Moina Shaiq Common
- 3371 Baywood Terrace Unit 214
- 34926 Osprey Dr
- 3134 Warwick Rd
- 3530 Oakwood Terrace Unit 102
- 2224 Peacock Place Unit 3
- 34917 Sea Cliff Terrace
- 3507 Buttonwood Terrace Unit 203
- 3300 Red Cedar Terrace Unit LU25
- 35560 Monterra Terrace Unit 301
- 1157 Silver St
- 2421 Maraschino Place
- 2404 Maraschino Place
- 35856 Adobe Dr
- 35978 Magellan Dr
- 35803 Augustine Place
- 35807 Augustine Place
- 35772 Gissing Place
- 35778 Gissing Place
- 35801 Augustine Place
- 35766 Gissing Place
- 35811 Augustine Place
- 35806 Augustine Place
- 35784 Gissing Place
- 35802 Augustine Place
- 35808 Augustine Place
- 35760 Gissing Place
- 35783 Augustine Place
- 35800 Augustine Place
- 35815 Augustine Place
- 35790 Gissing Place
- 35754 Gissing Place
- 35818 Augustine Place
- 35817 Augustine Place
- 35773 Augustine Place