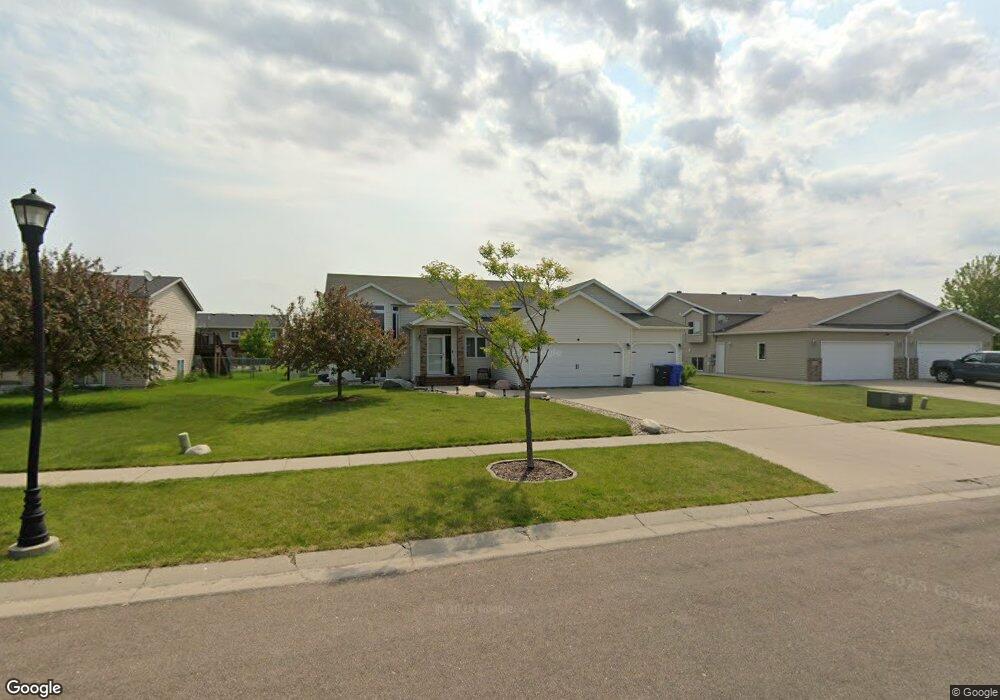
3582 Fillmore St S Fargo, ND 58104
Pointe West NeighborhoodEstimated Value: $288,000 - $395,000
2
Beds
1
Bath
2,143
Sq Ft
$162/Sq Ft
Est. Value
About This Home
This home is located at 3582 Fillmore St S, Fargo, ND 58104 and is currently estimated at $348,151, approximately $162 per square foot. 3582 Fillmore St S is a home located in Cass County with nearby schools including Kennedy Elementary School, Discovery Middle School, and Fargo Davies High School.
Ownership History
Date
Name
Owned For
Owner Type
Purchase Details
Closed on
Apr 15, 2022
Sold by
Haider Ray A
Bought by
Fyhrie Michael Sean
Current Estimated Value
Home Financials for this Owner
Home Financials are based on the most recent Mortgage that was taken out on this home.
Original Mortgage
$280,250
Outstanding Balance
$261,846
Interest Rate
3.76%
Mortgage Type
New Conventional
Estimated Equity
$86,305
Purchase Details
Closed on
Feb 13, 2008
Sold by
Matrix Properties Corp
Bought by
Viland Construction Inc
Purchase Details
Closed on
May 3, 2006
Sold by
Matrix Properties Corporation
Bought by
J V Hough Inc
Home Financials for this Owner
Home Financials are based on the most recent Mortgage that was taken out on this home.
Original Mortgage
$20,900
Interest Rate
6.54%
Mortgage Type
Unknown
Purchase Details
Closed on
Apr 20, 2006
Sold by
J V Hough Inc
Bought by
Haider Ray A
Home Financials for this Owner
Home Financials are based on the most recent Mortgage that was taken out on this home.
Original Mortgage
$20,900
Interest Rate
6.54%
Mortgage Type
Unknown
Create a Home Valuation Report for This Property
The Home Valuation Report is an in-depth analysis detailing your home's value as well as a comparison with similar homes in the area
Home Values in the Area
Average Home Value in this Area
Purchase History
| Date | Buyer | Sale Price | Title Company |
|---|---|---|---|
| Fyhrie Michael Sean | $295,000 | The Title Company | |
| Viland Construction Inc | -- | -- | |
| J V Hough Inc | -- | -- | |
| Haider Ray A | -- | -- |
Source: Public Records
Mortgage History
| Date | Status | Borrower | Loan Amount |
|---|---|---|---|
| Open | Fyhrie Michael Sean | $280,250 | |
| Previous Owner | J V Hough Inc | $20,900 | |
| Previous Owner | Haider Ray A | $111,600 |
Source: Public Records
Tax History Compared to Growth
Tax History
| Year | Tax Paid | Tax Assessment Tax Assessment Total Assessment is a certain percentage of the fair market value that is determined by local assessors to be the total taxable value of land and additions on the property. | Land | Improvement |
|---|---|---|---|---|
| 2024 | $6,266 | $170,450 | $35,800 | $134,650 |
| 2023 | $6,056 | $164,250 | $37,900 | $126,350 |
| 2022 | $5,654 | $146,650 | $37,900 | $108,750 |
| 2021 | $5,324 | $136,400 | $37,900 | $98,500 |
| 2020 | $5,328 | $136,400 | $37,900 | $98,500 |
| 2019 | $5,290 | $135,400 | $23,700 | $111,700 |
| 2018 | $5,239 | $135,400 | $23,700 | $111,700 |
| 2017 | $4,745 | $117,450 | $23,700 | $93,750 |
| 2016 | $4,375 | $106,750 | $23,700 | $83,050 |
| 2015 | $4,748 | $115,350 | $16,100 | $99,250 |
| 2014 | $4,529 | $99,800 | $16,100 | $83,700 |
| 2013 | $4,363 | $93,250 | $16,100 | $77,150 |
Source: Public Records
Map
Nearby Homes
- 4216 34th Ave S
- 4306 39th Ave S
- 4293 39 1 2 Ave S
- 4276 39 1 2 Ave S
- 4318 39 1 2 Ave S
- 4274 39 1 2 Ave S
- 3606 Decorah Way S
- 3624 Decorah Way
- 3630 Decorah Way S
- 3612 Decorah Way S
- 4801 Decorah Way S
- 3166 Sienna Dr S
- 4245 Coventry Dr S
- 1665 3-Stall Plan at The Residence at Valley View Estates
- 4824 Decorah Way S
- 4849 Decorah Way S
- 3712 49th St S
- 4889 Chelsea Ln S
- 4176 Arthur Dr
- 4168 Arthur Dr
- 3588 Fillmore St S
- 3570 Fillmore St S
- 3577 Taylor St S
- 3591 Taylor St S
- 3565 Taylor St S
- 3558 Fillmore St S
- 3593 Taylor St S
- 3589 Fillmore St S
- 3587 Fillmore St S
- 3553 Taylor St S
- 3595 Taylor St S
- 3573 Fillmore St S
- 3544 Fillmore St S
- 3561 Fillmore St S
- 3541 Taylor St S
- 3602 Fillmore St S
- 3605 Fillmore St S
- 3547 Fillmore St S
- 3604 Fillmore St S
- 3532 Fillmore St S