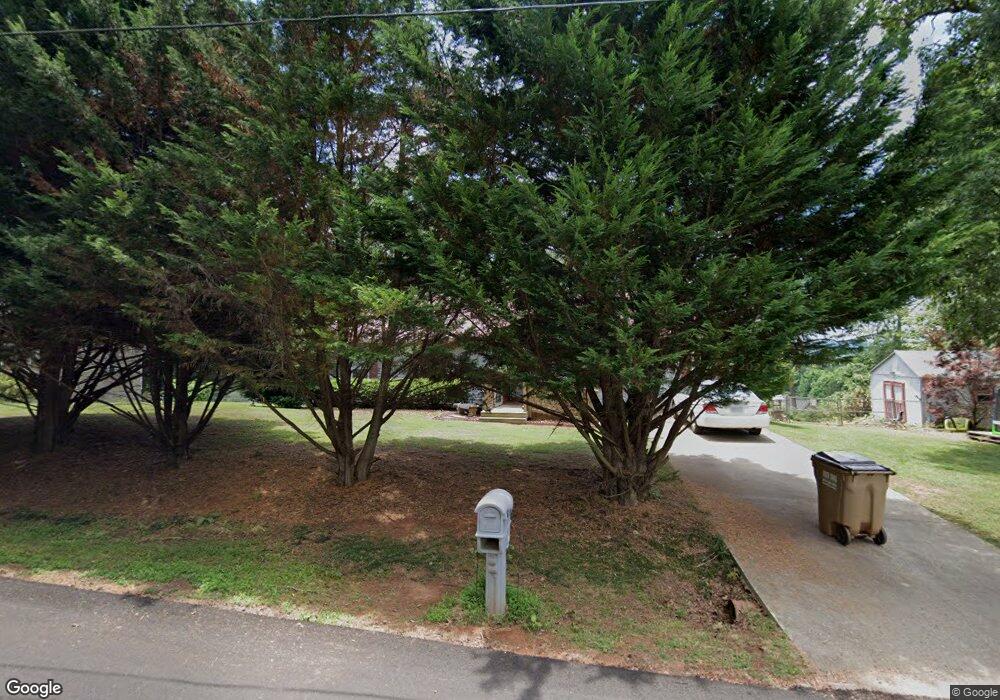
3582 Sequoia Rd Gainesville, GA 30506
Estimated Value: $319,000 - $336,000
3
Beds
2
Baths
1,512
Sq Ft
$218/Sq Ft
Est. Value
About This Home
This home is located at 3582 Sequoia Rd, Gainesville, GA 30506 and is currently estimated at $330,073, approximately $218 per square foot. 3582 Sequoia Rd is a home located in Hall County with nearby schools including Sardis Elementary School, Cartersville Primary School, and Chestatee Middle School.
Ownership History
Date
Name
Owned For
Owner Type
Purchase Details
Closed on
Mar 17, 2017
Sold by
Ledford Coy Dean
Bought by
Mcclellan Tammi Lorri
Current Estimated Value
Purchase Details
Closed on
Nov 6, 2013
Sold by
Ledford Wilma Jean
Bought by
Mcclellan Michael Ray
Purchase Details
Closed on
Oct 11, 2001
Sold by
C & E Properties & Development
Bought by
Ledford Coy and Ledford Wilma J
Home Financials for this Owner
Home Financials are based on the most recent Mortgage that was taken out on this home.
Original Mortgage
$29,663
Interest Rate
6.87%
Mortgage Type
New Conventional
Purchase Details
Closed on
Aug 9, 2001
Sold by
Jarrard Michael Terry
Bought by
C & E Properties & Dev Inc
Home Financials for this Owner
Home Financials are based on the most recent Mortgage that was taken out on this home.
Original Mortgage
$76,596
Interest Rate
7.1%
Mortgage Type
New Conventional
Create a Home Valuation Report for This Property
The Home Valuation Report is an in-depth analysis detailing your home's value as well as a comparison with similar homes in the area
Home Values in the Area
Average Home Value in this Area
Purchase History
| Date | Buyer | Sale Price | Title Company |
|---|---|---|---|
| Mcclellan Tammi Lorri | $107,026 | -- | |
| Mcclellan Michael Ray | -- | -- | |
| Ledford Coy | $90,000 | -- | |
| C & E Properties & Dev Inc | $17,000 | -- |
Source: Public Records
Mortgage History
| Date | Status | Borrower | Loan Amount |
|---|---|---|---|
| Previous Owner | Ledford Coy | $29,663 | |
| Previous Owner | C & E Properties & Dev Inc | $76,596 |
Source: Public Records
Tax History Compared to Growth
Tax History
| Year | Tax Paid | Tax Assessment Tax Assessment Total Assessment is a certain percentage of the fair market value that is determined by local assessors to be the total taxable value of land and additions on the property. | Land | Improvement |
|---|---|---|---|---|
| 2024 | $2,569 | $101,088 | $11,120 | $89,968 |
| 2023 | $2,779 | $109,608 | $11,120 | $98,488 |
| 2022 | $2,322 | $87,368 | $11,120 | $76,248 |
| 2021 | $1,672 | $60,928 | $3,600 | $57,328 |
| 2020 | $1,657 | $58,608 | $3,600 | $55,008 |
| 2019 | $1,582 | $55,328 | $3,600 | $51,728 |
| 2018 | $1,280 | $42,810 | $4,240 | $38,570 |
| 2017 | $457 | $42,810 | $4,240 | $38,570 |
| 2016 | $416 | $42,810 | $4,240 | $38,570 |
| 2015 | $417 | $42,810 | $4,240 | $38,570 |
| 2014 | $417 | $42,810 | $4,240 | $38,570 |
Source: Public Records
Map
Nearby Homes
- 3579 Sequoia Rd
- 4683 Giddon Martin Rd
- 4719 Giddon Martin Rd
- 4690 Giddon Martin Rd
- 4312 Green Hill Rd
- 3746 Leach Rd
- 3292 High View Ct
- 4722 Middleboro Ln
- 3286 High View Ct
- 4704 Hanson Hills Ct
- 3117 Shelter Cove
- 4606 Enfield Dr
- 4135 Cha Co Rd
- 3114 Lake Ranch Dr
- 4522 Old Princeton Ridge
- 4506 Old Princeton Ridge Unit 1
- 6589 Sequoia Rd
- 3586 Sequoia Rd
- 3525 Phoenix Cove Dr Unit 16
- 3525 Phoenix Cove Dr
- 3583 Sequoia Rd
- 3589 Sequoia Rd
- 3521 Phoenix Cove Dr Unit 15
- 3588 Sequoia Rd
- 3588 Sequoia Rd Unit 20
- 3575 Sequoia Rd
- 3535 Phoenix Cove Dr
- 3517 Phoenix Cove Dr
- 3517 Phoenix Cove Dr Unit 14
- 3513 Phoenix Cove Dr
- 3495 Osceola Trail
- 3499 Osceola Trail
- 3514 Phoenix Cove Dr Unit Na
- 3514 Phoenix Cove Dr
- 3565 Sequoia Rd
- 3491 Osceola Trail