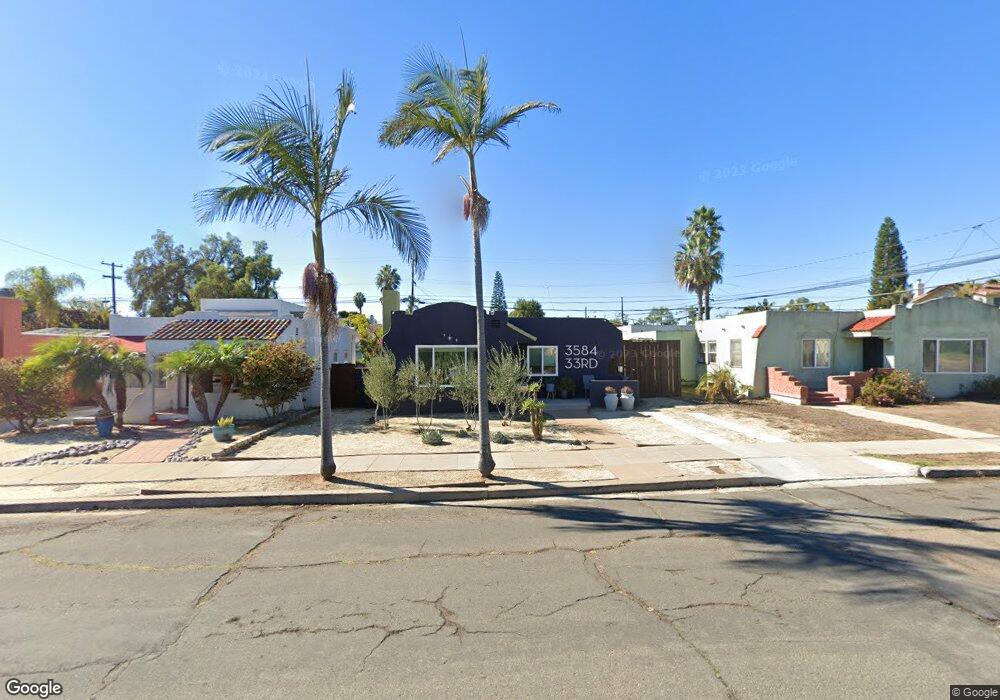
3584 33rd St San Diego, CA 92104
North Park NeighborhoodEstimated Value: $889,000 - $1,379,000
2
Beds
1
Bath
833
Sq Ft
$1,376/Sq Ft
Est. Value
About This Home
This home is located at 3584 33rd St, San Diego, CA 92104 and is currently estimated at $1,146,304, approximately $1,376 per square foot. 3584 33rd St is a home located in San Diego County with nearby schools including McKinley Elementary School, Roosevelt International Middle School, and Kindred Montessori.
Ownership History
Date
Name
Owned For
Owner Type
Purchase Details
Closed on
Oct 21, 2021
Sold by
Burrows Dean M
Bought by
Burrows Dean M and The Dean M Burrows Revocable T
Current Estimated Value
Purchase Details
Closed on
Jun 13, 2017
Sold by
Stapleton Timothy A
Bought by
Burrows Dean M
Home Financials for this Owner
Home Financials are based on the most recent Mortgage that was taken out on this home.
Original Mortgage
$562,500
Outstanding Balance
$468,267
Interest Rate
4.05%
Mortgage Type
New Conventional
Estimated Equity
$678,037
Purchase Details
Closed on
May 14, 2014
Sold by
Stapleton Timothy A
Bought by
Stapleton Timothy A
Purchase Details
Closed on
Oct 20, 2011
Sold by
Stapleton Timothy A
Bought by
Stapleton Timothy A
Purchase Details
Closed on
Nov 27, 2006
Sold by
Stapleton Timothy A
Bought by
Stapleton Timothy A
Purchase Details
Closed on
Nov 2, 1992
Purchase Details
Closed on
Aug 28, 1987
Purchase Details
Closed on
Nov 30, 1984
Create a Home Valuation Report for This Property
The Home Valuation Report is an in-depth analysis detailing your home's value as well as a comparison with similar homes in the area
Home Values in the Area
Average Home Value in this Area
Purchase History
| Date | Buyer | Sale Price | Title Company |
|---|---|---|---|
| Burrows Dean M | -- | None Available | |
| Burrows Dean M | $750,000 | Lawyers Title | |
| Stapleton Timothy A | -- | None Available | |
| Stapleton Timothy A | -- | None Available | |
| Stapleton Timothy A | -- | None Available | |
| -- | $163,000 | -- | |
| -- | $115,000 | -- | |
| -- | $90,000 | -- |
Source: Public Records
Mortgage History
| Date | Status | Borrower | Loan Amount |
|---|---|---|---|
| Open | Burrows Dean M | $562,500 |
Source: Public Records
Tax History Compared to Growth
Tax History
| Year | Tax Paid | Tax Assessment Tax Assessment Total Assessment is a certain percentage of the fair market value that is determined by local assessors to be the total taxable value of land and additions on the property. | Land | Improvement |
|---|---|---|---|---|
| 2025 | $10,547 | $870,431 | $485,037 | $385,394 |
| 2024 | $10,547 | $853,365 | $475,527 | $377,838 |
| 2023 | $10,314 | $836,633 | $466,203 | $370,430 |
| 2022 | $10,038 | $820,229 | $457,062 | $363,167 |
| 2021 | $9,968 | $804,147 | $448,100 | $356,047 |
| 2020 | $9,847 | $795,903 | $443,506 | $352,397 |
| 2019 | $9,672 | $780,298 | $434,810 | $345,488 |
| 2018 | $9,043 | $764,999 | $426,285 | $338,714 |
| 2017 | $2,822 | $243,466 | $135,668 | $107,798 |
| 2016 | $2,774 | $238,693 | $133,008 | $105,685 |
| 2015 | $2,732 | $235,109 | $131,011 | $104,098 |
| 2014 | $2,688 | $230,504 | $128,445 | $102,059 |
Source: Public Records
Map
Nearby Homes
- 3572 33rd St
- 0 Boundary St Unit SB25155904
- 3509-11 32nd St
- 3694 33rd St
- 3388 Bancroft St
- 3167 Landis St
- 3780 32nd St
- 3515 Vancouver Ave
- 3739 31st St
- 3322 Nile St
- 3421 Vancouver Ave
- 3410 Grim Ave
- 3780 Swift Ave Unit 3
- 3365-69 Grim Ave
- 3744 Grim Ave Unit 1
- 3760 Grim Ave
- 0 35th St
- 3209-13 31st St
- 3376 30th St
- 3939 Illinois St Unit 1C