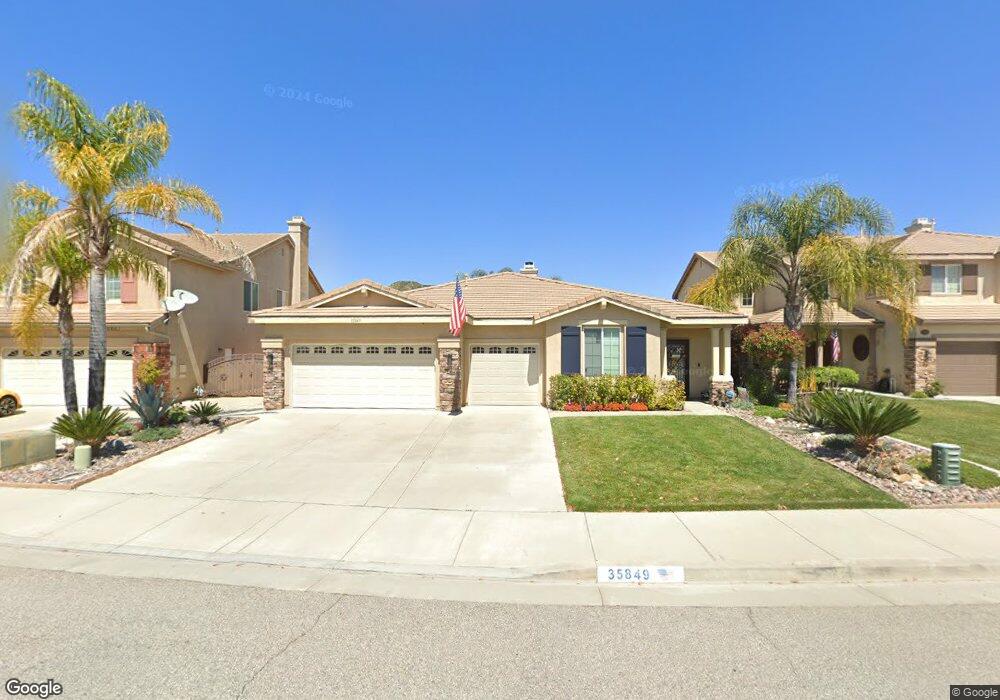
35849 Camelot Cir Wildomar, CA 92595
Estimated Value: $665,000 - $689,000
4
Beds
3
Baths
2,408
Sq Ft
$281/Sq Ft
Est. Value
About This Home
This home is located at 35849 Camelot Cir, Wildomar, CA 92595 and is currently estimated at $677,065, approximately $281 per square foot. 35849 Camelot Cir is a home located in Riverside County with nearby schools including Ronald Reagan Elementary School, David A. Brown Middle School, and Elsinore High School.
Ownership History
Date
Name
Owned For
Owner Type
Purchase Details
Closed on
Oct 10, 2019
Sold by
Richardson Aurora Delizo
Bought by
Brumund Paul D and Brumund Jill
Current Estimated Value
Home Financials for this Owner
Home Financials are based on the most recent Mortgage that was taken out on this home.
Original Mortgage
$416,320
Interest Rate
3.25%
Mortgage Type
FHA
Purchase Details
Closed on
Dec 18, 2011
Sold by
Richardson Richard K
Bought by
Richardson Aurora Delizo
Home Financials for this Owner
Home Financials are based on the most recent Mortgage that was taken out on this home.
Original Mortgage
$186,400
Interest Rate
3.94%
Mortgage Type
New Conventional
Purchase Details
Closed on
Aug 4, 2004
Sold by
Oakmont 96 Llc
Bought by
Delizo Aurora B
Home Financials for this Owner
Home Financials are based on the most recent Mortgage that was taken out on this home.
Original Mortgage
$210,000
Interest Rate
5.82%
Mortgage Type
Purchase Money Mortgage
Create a Home Valuation Report for This Property
The Home Valuation Report is an in-depth analysis detailing your home's value as well as a comparison with similar homes in the area
Home Values in the Area
Average Home Value in this Area
Purchase History
| Date | Buyer | Sale Price | Title Company |
|---|---|---|---|
| Brumund Paul D | $428,000 | Chicago Title Company | |
| Richardson Aurora Delizo | -- | Stewart Title Of California | |
| Delizo Aurora B | $354,000 | Fidelity National Title |
Source: Public Records
Mortgage History
| Date | Status | Borrower | Loan Amount |
|---|---|---|---|
| Previous Owner | Brumund Paul D | $416,320 | |
| Previous Owner | Richardson Aurora Delizo | $186,400 | |
| Previous Owner | Delizo Aurora B | $210,000 |
Source: Public Records
Tax History Compared to Growth
Tax History
| Year | Tax Paid | Tax Assessment Tax Assessment Total Assessment is a certain percentage of the fair market value that is determined by local assessors to be the total taxable value of land and additions on the property. | Land | Improvement |
|---|---|---|---|---|
| 2025 | $6,173 | $468,076 | $98,426 | $369,650 |
| 2023 | $6,173 | $449,902 | $94,605 | $355,297 |
| 2022 | $5,992 | $441,081 | $92,750 | $348,331 |
| 2021 | $5,977 | $432,433 | $90,932 | $341,501 |
| 2020 | $5,913 | $426,337 | $119,974 | $306,363 |
| 2019 | $5,781 | $413,920 | $116,480 | $297,440 |
| 2018 | $5,668 | $398,000 | $112,000 | $286,000 |
| 2017 | $5,398 | $372,000 | $105,000 | $267,000 |
| 2016 | $5,204 | $360,000 | $102,000 | $258,000 |
| 2015 | $5,089 | $337,000 | $95,000 | $242,000 |
| 2014 | $4,830 | $318,000 | $90,000 | $228,000 |
Source: Public Records
Map
Nearby Homes
- 25199 Loring Rd
- 35610 Jewel Ln
- 36029 Mustang Spirit Ln
- 36060 Lipizzan Ln
- 39944 Spicewood Ave
- 25180 Elliott Rd Unit 1
- 25111 Cedar Ridge Ct
- 39785 Spinning Wheel Dr
- 25018 Crimson Lasso Dr
- 23573 Spindle Way
- 24839 Kentman Ct
- 23634 Underwood Cir
- 35965 Darcy Place
- 39560 Tinderbox Way
- 23466 Saratoga Springs Place
- 23641 Lincoln Ave
- 35944 Wilcox Ln
- 35467 Meadow Park Cir
- 23664 Groveland Place
- 23489 Brigin Place
- 35837 Camelot Cir
- 35837 Camelot Cir
- 35861 Camelot Cir
- 25367 Chesterfield Ln
- 35825 Camelot Cir
- 25355 Chesterfield Ln
- 25379 Chesterfield Ln
- 35873 Camelot Cir
- 25343 Chesterfield Ln
- 25391 Chesterfield Ln
- 35880 Camelot Cir
- 35813 Camelot Cir
- 35844 Camelot Cir
- 35885 Camelot Cir
- 25331 Chesterfield Ln
- 25403 Chesterfield Ln
- 35832 Camelot Cir
- 35897 Camelot Cir
- 35820 Camelot Cir
- 25319 Chesterfield Ln