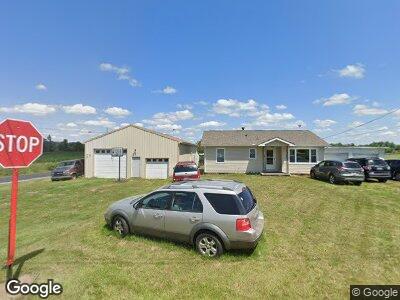
3585 Force Rd Shreve, OH 44676
Estimated Value: $151,000 - $188,058
2
Beds
1
Bath
922
Sq Ft
$187/Sq Ft
Est. Value
About This Home
This home is located at 3585 Force Rd, Shreve, OH 44676 and is currently estimated at $172,265, approximately $186 per square foot. 3585 Force Rd is a home located in Wayne County with nearby schools including Triway High School, ORCHARD LANE SCHOOL, and Sunny Slope C/O Ervin Mast.
Ownership History
Date
Name
Owned For
Owner Type
Purchase Details
Closed on
Sep 8, 2003
Sold by
Leatherman Linda Sue
Bought by
Leatherman Paul Samuel
Current Estimated Value
Home Financials for this Owner
Home Financials are based on the most recent Mortgage that was taken out on this home.
Original Mortgage
$82,000
Interest Rate
8.25%
Mortgage Type
Unknown
Purchase Details
Closed on
Aug 24, 2000
Sold by
Markley Harold E
Bought by
Leatherman Paul S and Leatherman Linda S
Home Financials for this Owner
Home Financials are based on the most recent Mortgage that was taken out on this home.
Original Mortgage
$55,000
Interest Rate
8.12%
Mortgage Type
New Conventional
Purchase Details
Closed on
Feb 27, 1989
Sold by
Eason Faye E and Eason Richard W
Bought by
Markley Harold E and Markley Teresa
Create a Home Valuation Report for This Property
The Home Valuation Report is an in-depth analysis detailing your home's value as well as a comparison with similar homes in the area
Home Values in the Area
Average Home Value in this Area
Purchase History
| Date | Buyer | Sale Price | Title Company |
|---|---|---|---|
| Leatherman Paul Samuel | -- | Service First Title Agency L | |
| Leatherman Paul S | $72,000 | -- | |
| Markley Harold E | $35,000 | -- |
Source: Public Records
Mortgage History
| Date | Status | Borrower | Loan Amount |
|---|---|---|---|
| Open | Killinger Christopher | $104,000 | |
| Closed | Killinger Christopher | $35,000 | |
| Closed | Leatherman Paul Samuel | $82,000 | |
| Closed | Leatherman Paul S | $55,000 |
Source: Public Records
Tax History Compared to Growth
Tax History
| Year | Tax Paid | Tax Assessment Tax Assessment Total Assessment is a certain percentage of the fair market value that is determined by local assessors to be the total taxable value of land and additions on the property. | Land | Improvement |
|---|---|---|---|---|
| 2024 | $1,460 | $48,060 | $7,490 | $40,570 |
| 2023 | $1,829 | $48,060 | $7,490 | $40,570 |
| 2022 | $1,505 | $35,600 | $5,550 | $30,050 |
| 2021 | $1,508 | $35,600 | $5,550 | $30,050 |
| 2020 | $1,365 | $35,600 | $5,550 | $30,050 |
| 2019 | $1,091 | $27,570 | $3,990 | $23,580 |
| 2018 | $1,097 | $27,570 | $3,990 | $23,580 |
| 2017 | $1,063 | $27,570 | $3,990 | $23,580 |
| 2016 | $1,057 | $26,450 | $3,990 | $22,460 |
| 2015 | $1,032 | $26,450 | $3,990 | $22,460 |
| 2014 | $839 | $21,550 | $3,990 | $17,560 |
| 2013 | $889 | $21,720 | $5,170 | $16,550 |
Source: Public Records
Map
Nearby Homes
- 3459 Force Rd
- 401 N Market St
- 0 Force Rd Unit 5108355
- 593 N Main St
- 433 Liberty St
- 5558 Force Rd
- 5612 Force Rd
- 9602 Munson Rd
- 8978 S Funk Rd
- 8880 Ohio 83
- 4194 Batdorf Rd
- 13100 State Route 226
- 3940 Batdorf Rd
- 110 S Elyria Rd
- 10296 Newkirk Rd
- 2780 S Smyser Rd
- 7130 Non Pariel Rd
- 0 Wilderness Rd
- 2483 Shreve Rd
- 13575 County Road 100
- 3585 Force Rd
- 3570 Force Rd
- 9112 Cemetery Rd
- 3500 Force Rd
- 3753 Shreve Eastern Rd
- 3585 Shreve Eastern Rd
- 3400 Force Rd
- 3333 Force Rd
- 8677 Cemetery Rd
- 3506 Shreve Eastern Rd
- 3416 Shreve Eastern Rd
- 3841 Shreve Eastern Rd
- 3205 Shreve Eastern Rd
- 9390 Cemetery Rd
- 3257 Force Rd
- 3246 Force Rd
- 9464 Cemetery Rd
- 3181 Shreve Eastern Rd
- 3150 Force Rd
- 3178 Shreve Eastern Rd