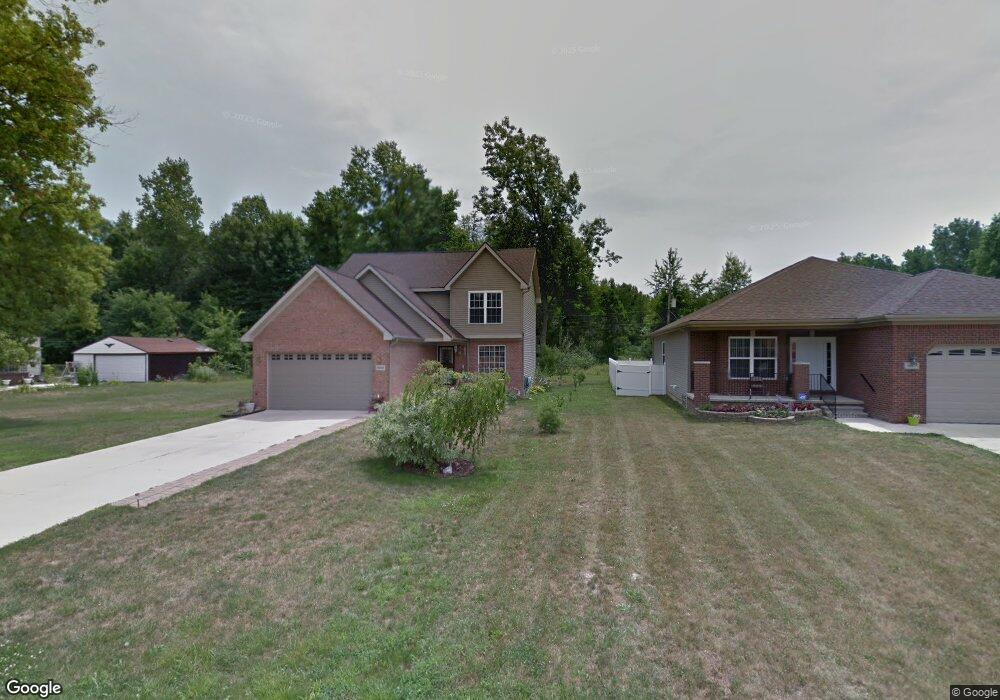
35857 Cypress St Unit Bldg-Unit Romulus, MI 48174
Estimated Value: $276,000 - $325,000
3
Beds
3
Baths
1,774
Sq Ft
$169/Sq Ft
Est. Value
About This Home
This home is located at 35857 Cypress St Unit Bldg-Unit, Romulus, MI 48174 and is currently estimated at $299,316, approximately $168 per square foot. 35857 Cypress St Unit Bldg-Unit is a home located in Wayne County with nearby schools including Wick Elementary School, Romulus Middle School, and Romulus Senior High School.
Ownership History
Date
Name
Owned For
Owner Type
Purchase Details
Closed on
Aug 20, 2018
Sold by
Cunegin Stella
Bought by
Hall Anthony
Current Estimated Value
Purchase Details
Closed on
May 18, 2017
Sold by
Cunegin Stella
Bought by
Deutsche Bank Trust Company Amercas
Purchase Details
Closed on
Nov 22, 2005
Sold by
Miller Earl F
Bought by
Cunegin Stella
Create a Home Valuation Report for This Property
The Home Valuation Report is an in-depth analysis detailing your home's value as well as a comparison with similar homes in the area
Home Values in the Area
Average Home Value in this Area
Purchase History
| Date | Buyer | Sale Price | Title Company |
|---|---|---|---|
| Hall Anthony | $168,000 | Fidelity Title | |
| Deutsche Bank Trust Company Amercas | $157,877 | None Available | |
| Cunegin Stella | $190,000 | Express Title Agency Inc |
Source: Public Records
Tax History
| Year | Tax Paid | Tax Assessment Tax Assessment Total Assessment is a certain percentage of the fair market value that is determined by local assessors to be the total taxable value of land and additions on the property. | Land | Improvement |
|---|---|---|---|---|
| 2025 | $2,861 | $151,900 | $0 | $0 |
| 2024 | $2,868 | $120,700 | $0 | $0 |
| 2023 | $2,745 | $95,300 | $0 | $0 |
| 2022 | $3,256 | $92,200 | $0 | $0 |
| 2021 | $3,151 | $81,100 | $0 | $0 |
| 2020 | $3,085 | $58,800 | $0 | $0 |
| 2019 | $3,091 | $56,400 | $0 | $0 |
| 2018 | $1,982 | $56,500 | $0 | $0 |
| 2017 | $1,553 | $55,400 | $0 | $0 |
| 2016 | $2,643 | $56,800 | $0 | $0 |
| 2015 | $5,328 | $55,100 | $0 | $0 |
| 2013 | $5,250 | $57,400 | $0 | $0 |
| 2012 | $1,510 | $55,400 | $4,900 | $50,500 |
Source: Public Records
Map
Nearby Homes
- 36227 Vinewood St
- 000 Waynecorse
- 35799 Park Place
- 35431 Beverly Rd
- 35344 Ecorse Rd
- 6130 Wayne Rd
- 6073 Biddle St
- 6358 Dexter St
- 000 Cincinnati St
- 5834 Wayne Rd
- Lot 227 Dexter St
- 0000 Park Place
- 6011 Washington St
- 37207 Ecorse Rd
- Lot 215 2nd St
- Lot 214 2nd St
- 35773 Surrey Ct
- 7175 Ozga St
- 6071 Dexter St
- 8080 Wayne Rd
- 35857 Cypress St
- 35875 Cypress St
- 35841 Cypress St
- vacantland Cypress St
- 37562 Cypress St
- 35898 Cypress St
- 35898 Cypress St
- 35856 Cypress St
- 35856 Cypress St
- 35815 Cypress St
- 35889 Cypress St
- 35911 Vinewood St
- 35865 Vinewood St
- 35865 Vinewood St
- 35865 Vinewood St
- 35865 Vinewood St
- 35841 Vinewood St
- 35937 Vinewood St
- 35925 Vinewood St
- 35966 Cypress St
Your Personal Tour Guide
Ask me questions while you tour the home.