3586 Payne Ave Unit 12 San Jose, CA 95117
Castlemont NeighborhoodEstimated payment $3,331/month
Highlights
- Very Popular Property
- In Ground Pool
- Laundry Facilities
- George C. Payne Elementary School Rated A-
- Eat-In Kitchen
About This Home
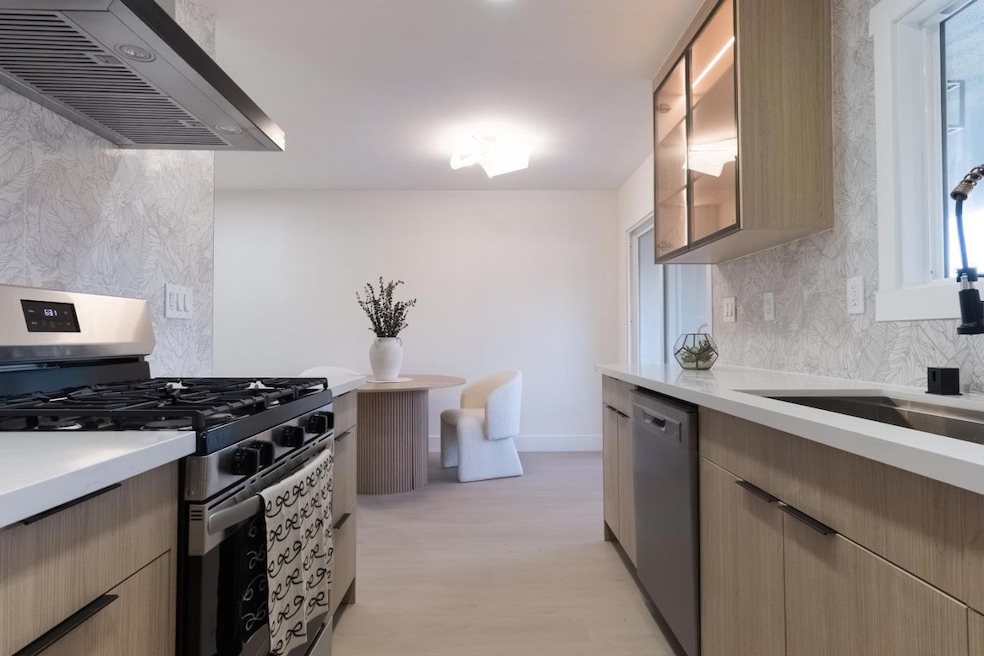
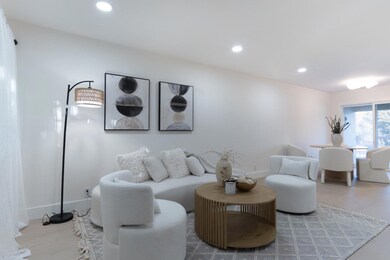
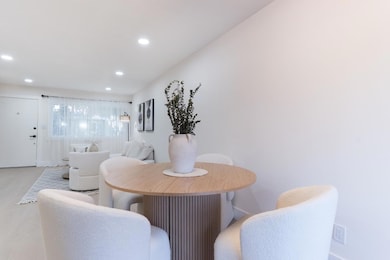
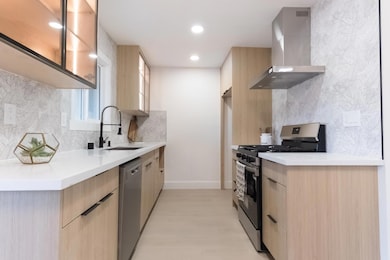
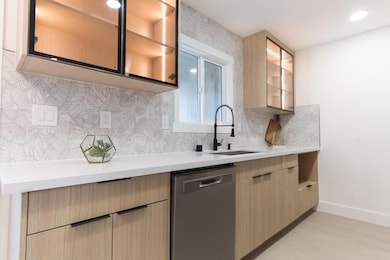
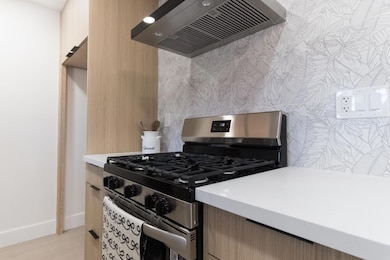
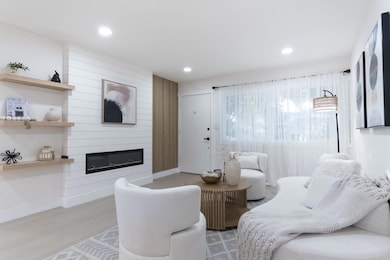
Discover this stunning, fully renovated 2-bedroom, 1-bath home offering 910 sq. ft. of modern luxury and comfort. Step into a bright, open living room filled with natural light, leading to a gorgeous galley kitchen with brand-new appliances, new cabinets, and quartz countertops perfect for everyday living and entertaining. The spa-inspired bathroom features porcelain tile, LED mirrors, and a new vanity. Enjoy premium upgrades throughout, including Level 5 smooth walls, dual-pane windows, luxury flooring, recessed lighting, and fresh interior paint. Conveniently located near top shopping, dining, and major attractions, this home offers the perfect blend of style, comfort, and convenience. Move-in ready and absolutely beautiful. A must-see house !

Property Details
Home Type
- Condominium
Est. Annual Taxes
- $3,718
Year Built
- Built in 1963
HOA Fees
- $404 Monthly HOA Fees
Parking
- 2 Carport Spaces
Home Design
- Slab Foundation
- Composition Roof
Interior Spaces
- 910 Sq Ft Home
- 1-Story Property
- Eat-In Kitchen
Bedrooms and Bathrooms
- 2 Bedrooms
- 1 Full Bathroom
Pool
- In Ground Pool
Utilities
- No Heating
- Separate Meters
Listing and Financial Details
- Assessor Parcel Number 305-13-066
Community Details
Overview
- Association fees include exterior painting, fencing, garbage, landscaping / gardening, insurance - liability, management fee, pool spa or tennis, roof, common area electricity, maintenance - common area
- 70 Units
- Stonegate Villas Assoc Association
- Built by Stonegate Villas
Amenities
- Laundry Facilities
Recreation
- Community Pool
Pet Policy
- Limit on the number of pets
Map
Home Values in the Area
Average Home Value in this Area
Tax History
| Year | Tax Paid | Tax Assessment Tax Assessment Total Assessment is a certain percentage of the fair market value that is determined by local assessors to be the total taxable value of land and additions on the property. | Land | Improvement |
|---|---|---|---|---|
| 2025 | $3,718 | $239,746 | $116,799 | $122,947 |
| 2024 | $3,718 | $235,046 | $114,509 | $120,537 |
| 2023 | $3,658 | $230,438 | $112,264 | $118,174 |
| 2022 | $3,619 | $225,920 | $110,063 | $115,857 |
| 2021 | $3,553 | $221,491 | $107,905 | $113,586 |
| 2020 | $3,505 | $219,221 | $106,799 | $112,422 |
| 2019 | $3,396 | $214,923 | $104,705 | $110,218 |
| 2018 | $3,322 | $210,709 | $102,652 | $108,057 |
| 2017 | $3,283 | $206,579 | $100,640 | $105,939 |
| 2016 | $3,078 | $202,529 | $98,667 | $103,862 |
| 2015 | $3,047 | $199,487 | $97,185 | $102,302 |
| 2014 | $2,936 | $195,581 | $95,282 | $100,299 |
Property History
| Date | Event | Price | List to Sale | Price per Sq Ft | Prior Sale |
|---|---|---|---|---|---|
| 12/05/2025 12/05/25 | For Sale | $498,888 | +66.3% | $548 / Sq Ft | |
| 10/15/2025 10/15/25 | Sold | $300,000 | -- | $330 / Sq Ft | View Prior Sale |
| 10/15/2025 10/15/25 | Pending | -- | -- | -- |
Purchase History
| Date | Type | Sale Price | Title Company |
|---|---|---|---|
| Grant Deed | $300,000 | Wfg National Title | |
| Interfamily Deed Transfer | $115,000 | Chicago Title Co | |
| Interfamily Deed Transfer | -- | Chicago Title Co | |
| Interfamily Deed Transfer | -- | Chicago Title Co |
Mortgage History
| Date | Status | Loan Amount | Loan Type |
|---|---|---|---|
| Previous Owner | $92,000 | No Value Available | |
| Previous Owner | $87,750 | No Value Available |
Source: MLSListings
MLS Number: ML82028942
APN: 305-13-066
Disclaimer: Certain information contained herein is derived from information provided by parties other than Homes.com. All information provided is deemed reliable, but is not guaranteed to be accurate and should be independently verified.
![]() Property Information © 2025 MLSListings Inc. All rights reserved. Listing information is deemed reliable but not guaranteed. Certain information contained herein is derived from information which is the licensed property of, and copyrighted by, MLSListings Inc. The viewer acknowledges ownership and validity of its copyright. Information provided is for personal, non-commercial use by a viewer with a bona fide interest in the purchase or sale of real estate of the type being offered via this website or other electronic means. The viewer is prohibited from copying, redistributing or retransmitting any of the data or information provided by MLSListing, Inc.
Property Information © 2025 MLSListings Inc. All rights reserved. Listing information is deemed reliable but not guaranteed. Certain information contained herein is derived from information which is the licensed property of, and copyrighted by, MLSListings Inc. The viewer acknowledges ownership and validity of its copyright. Information provided is for personal, non-commercial use by a viewer with a bona fide interest in the purchase or sale of real estate of the type being offered via this website or other electronic means. The viewer is prohibited from copying, redistributing or retransmitting any of the data or information provided by MLSListing, Inc.
- 1369 Phelps Ave Unit 9
- 1375 Pinehurst Square
- 3592 Payne Ave Unit 6
- 1350 Merrivale Square W
- 1350 Charmwood Square
- 1329 Essex Way
- 3264 Valley Square Ln
- 3228 Williamsburg Dr
- 1112 Nottingham Place
- 3147 Williamsburg Dr
- 341 Carlyn Ave
- 3813 Barker Dr
- 411 Dunster Dr
- 1295 Flora Ave
- 3220 Williams Rd
- 1114 S Winchester Blvd Unit 1114
- 375 N 3rd St Unit 3
- 4478 Colombo Dr
- 115 Superior Dr
- 801 S Winchester Blvd Unit 4116
- 1344 Merrivale West Square
- 1369 Cherrywood Square
- 3685 Cape Cod Ct Unit 1
- 3691 Cape Cod Ct
- 600 Marathon Dr
- 651 W Hamilton Ave
- 999 W Hamilton Ave
- 1315 Eden Ave
- 1123 Starbird Cir Unit 3
- 3200 Payne Ave
- 1376 Klamath Dr
- 4000 Rhoda Dr Unit ID1308907P
- 160 W Hamilton Ave
- 1099 Roewill Dr
- 3990 Hamilton Ave
- 4026 Bismarck Dr Unit ID1319653P
- 1100 Ranchero Way Unit 15
- 1100 Ranchero Way Unit A
- 1324 S Winchester
- 1175 Ranchero Way