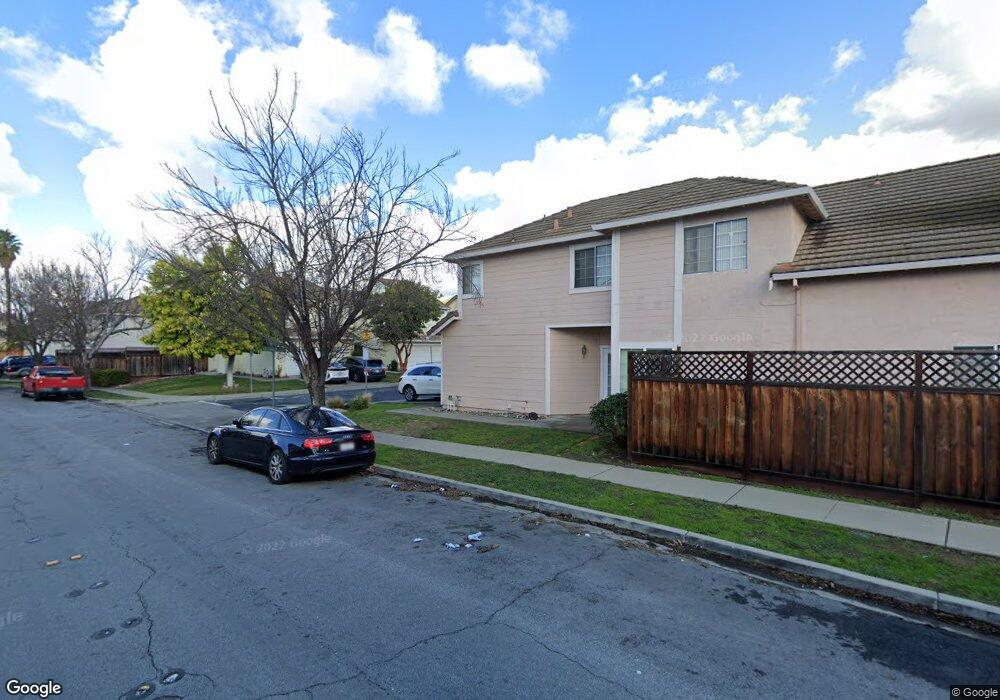
35867 Killorglin Common Fremont, CA 94536
Niles NeighborhoodEstimated Value: $1,307,591 - $1,599,000
2
Beds
3
Baths
1,460
Sq Ft
$1,025/Sq Ft
Est. Value
About This Home
This home is located at 35867 Killorglin Common, Fremont, CA 94536 and is currently estimated at $1,496,648, approximately $1,025 per square foot. 35867 Killorglin Common is a home located in Alameda County with nearby schools including Niles Elementary School, Centerville Junior High School, and Washington High School.
Ownership History
Date
Name
Owned For
Owner Type
Purchase Details
Closed on
Sep 8, 2015
Sold by
Chow David N and Chin Donna H
Bought by
David Chow & Donna Chin 2015 Trust
Current Estimated Value
Purchase Details
Closed on
Feb 11, 2009
Sold by
Chin Donna H
Bought by
Chow David N and Chin Donna H
Home Financials for this Owner
Home Financials are based on the most recent Mortgage that was taken out on this home.
Original Mortgage
$200,000
Interest Rate
4.92%
Mortgage Type
Purchase Money Mortgage
Purchase Details
Closed on
May 19, 2003
Sold by
Chow David N
Bought by
Chin Donna H
Home Financials for this Owner
Home Financials are based on the most recent Mortgage that was taken out on this home.
Original Mortgage
$130,000
Interest Rate
5.71%
Mortgage Type
Balloon
Create a Home Valuation Report for This Property
The Home Valuation Report is an in-depth analysis detailing your home's value as well as a comparison with similar homes in the area
Home Values in the Area
Average Home Value in this Area
Purchase History
| Date | Buyer | Sale Price | Title Company |
|---|---|---|---|
| David Chow & Donna Chin 2015 Trust | -- | None Available | |
| Chow David N | $100,000 | Chicago Title Company | |
| Chin Donna H | -- | First American Title Company |
Source: Public Records
Mortgage History
| Date | Status | Borrower | Loan Amount |
|---|---|---|---|
| Closed | Chow David N | $200,000 | |
| Closed | Chin Donna H | $130,000 |
Source: Public Records
Tax History Compared to Growth
Tax History
| Year | Tax Paid | Tax Assessment Tax Assessment Total Assessment is a certain percentage of the fair market value that is determined by local assessors to be the total taxable value of land and additions on the property. | Land | Improvement |
|---|---|---|---|---|
| 2025 | $4,591 | $339,460 | $148,244 | $191,216 |
| 2024 | $4,591 | $332,804 | $145,337 | $187,467 |
| 2023 | $4,456 | $326,279 | $142,488 | $183,791 |
| 2022 | $4,379 | $319,882 | $139,694 | $180,188 |
| 2021 | $4,278 | $313,610 | $136,955 | $176,655 |
| 2020 | $4,227 | $310,397 | $135,552 | $174,845 |
| 2019 | $4,183 | $304,311 | $132,894 | $171,417 |
| 2018 | $4,100 | $298,345 | $130,289 | $168,056 |
| 2017 | $3,998 | $292,497 | $127,735 | $164,762 |
| 2016 | $3,921 | $286,761 | $125,230 | $161,531 |
| 2015 | $3,860 | $282,454 | $123,349 | $159,105 |
| 2014 | $3,787 | $276,922 | $120,933 | $155,989 |
Source: Public Records
Map
Nearby Homes
- 36004 Vallee Terrace
- 35784 Linda Dr
- 35849 Linda Dr
- 315 Springstone Dr
- 36341 Mission Blvd
- 278 Junipero Common
- 78 Snyder Way
- 35563 Linda Dr
- 409 King Ave
- 375 Serramonte Terrace
- 470 Rego Common
- 35180 Mount Whitney Terrace
- 100 Arroyo Ct
- 77 Barnes Ln
- 35990 Copper St
- 375 Hillview Dr
- 217 Appian Way
- 213 Ladera Plaza Unit 13
- 208 Appian Way
- 37230 2nd St
- 35863 Killorglin Common
- 35871 Killorglin Common
- 35839 Killorglin Common
- 35875 Killorglin Common
- 35835 Killorglin Common
- 35879 Killorglin Common
- 35868 Killorglin Common
- 403 Grau Dr
- 35872 Killorglin Common
- 35860 Killorglin Common
- 415 Grau Dr
- 35848 Killorglin Common
- 35876 Killorglin Common
- 35840 Killorglin Common
- 35844 Killorglin Common
- 35856 Killorglin Common
- 35852 Killorglin Common
- 112 Kerry Common
- 124 Kerry Common
- 35880 Killorglin Common