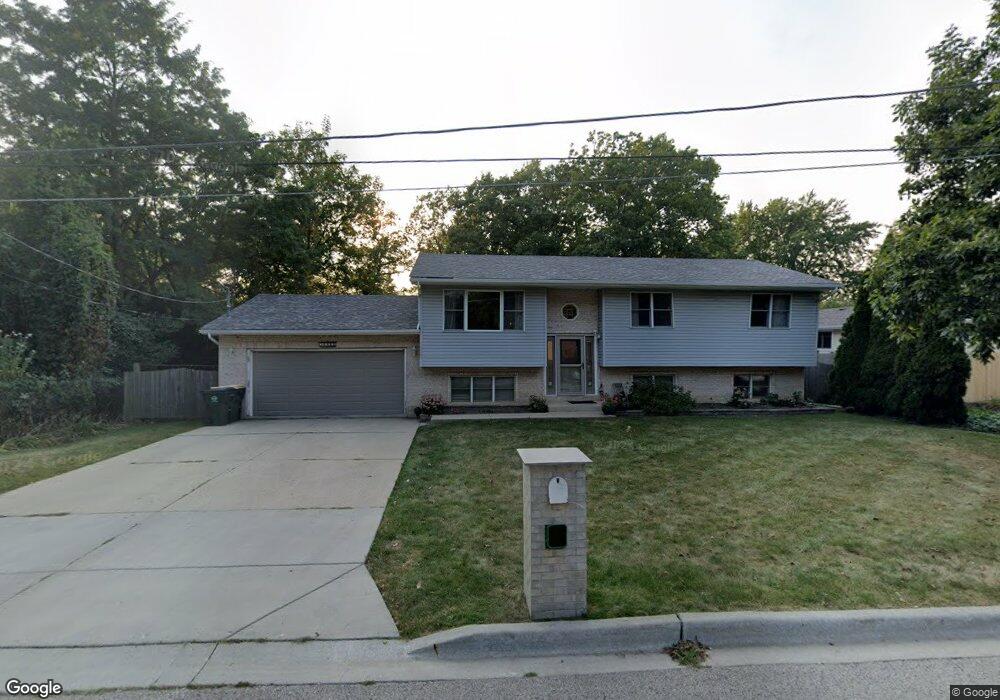
35880 N Ash St Ingleside, IL 60041
Estimated Value: $280,000 - $319,000
--
Bed
2
Baths
1,220
Sq Ft
$247/Sq Ft
Est. Value
About This Home
This home is located at 35880 N Ash St, Ingleside, IL 60041 and is currently estimated at $300,876, approximately $246 per square foot. 35880 N Ash St is a home located in Lake County with nearby schools including Gavin Central Elementary School, Gavin South Middle School, and Grant Community High School.
Ownership History
Date
Name
Owned For
Owner Type
Purchase Details
Closed on
Mar 8, 2001
Sold by
Carranza Amalia and Gamboa Miguel
Bought by
Carranza Amalia
Current Estimated Value
Home Financials for this Owner
Home Financials are based on the most recent Mortgage that was taken out on this home.
Original Mortgage
$75,700
Outstanding Balance
$27,791
Interest Rate
7.13%
Estimated Equity
$273,085
Purchase Details
Closed on
Jul 13, 1999
Sold by
Carranza Amalia
Bought by
Carranza Amalia and Gamboa Miguel
Home Financials for this Owner
Home Financials are based on the most recent Mortgage that was taken out on this home.
Original Mortgage
$70,000
Interest Rate
7.75%
Mortgage Type
Construction
Purchase Details
Closed on
May 20, 1999
Sold by
Neumuller John A and Neumuller Danette M
Bought by
Carranza Amalia
Home Financials for this Owner
Home Financials are based on the most recent Mortgage that was taken out on this home.
Original Mortgage
$70,000
Interest Rate
7.75%
Mortgage Type
Construction
Create a Home Valuation Report for This Property
The Home Valuation Report is an in-depth analysis detailing your home's value as well as a comparison with similar homes in the area
Home Values in the Area
Average Home Value in this Area
Purchase History
| Date | Buyer | Sale Price | Title Company |
|---|---|---|---|
| Carranza Amalia | -- | Imperial Land Title Inc | |
| Carranza Amalia | -- | Imperial Land Title Inc | |
| Carranza Amalia | $37,000 | -- |
Source: Public Records
Mortgage History
| Date | Status | Borrower | Loan Amount |
|---|---|---|---|
| Open | Carranza Amalia | $75,700 | |
| Closed | Carranza Amalia | $70,000 |
Source: Public Records
Tax History Compared to Growth
Tax History
| Year | Tax Paid | Tax Assessment Tax Assessment Total Assessment is a certain percentage of the fair market value that is determined by local assessors to be the total taxable value of land and additions on the property. | Land | Improvement |
|---|---|---|---|---|
| 2024 | $5,727 | $93,296 | $14,624 | $78,672 |
| 2023 | $5,735 | $82,433 | $13,777 | $68,656 |
| 2022 | $5,735 | $78,210 | $12,353 | $65,857 |
| 2021 | $5,536 | $73,721 | $11,644 | $62,077 |
| 2020 | $5,741 | $73,262 | $11,478 | $61,784 |
| 2019 | $5,544 | $70,255 | $11,007 | $59,248 |
| 2018 | $5,335 | $67,757 | $15,086 | $52,671 |
| 2017 | $5,212 | $62,628 | $13,944 | $48,684 |
| 2016 | $5,451 | $57,278 | $12,753 | $44,525 |
| 2015 | $5,663 | $53,451 | $11,901 | $41,550 |
| 2014 | $4,708 | $46,660 | $11,193 | $35,467 |
| 2012 | $3,386 | $48,619 | $11,663 | $36,956 |
Source: Public Records
Map
Nearby Homes
- 35835 N Benjamin Ave
- 35720 N Laurel Ave
- 35694 N Laurel Ave
- 35729 N Watson Ave
- 35531 N Sunnyside Ave
- 35663 N Helendale Rd
- 36379 N Wesley Rd
- 26177 W Lakeview Ave
- 36497 N Hawthorne Ln
- 605 Rollins Rd
- 35105 N Ingleside Dr
- 314 Mastodon Dr
- 35080 N Ellen Dr
- 35063 N Emerald Shores Ct
- 69 Washington St
- 26276 W Larkin Ln
- 35647 N Grove Ave
- 35611 N Grove Ave
- 26297 W Larkin Ln
- 25018 W Lake Shore Dr
- 35872 N Ash St
- 35896 N Ash St
- 35914 N Ash St
- 35850 N Ash St
- 35871 N Ash St
- 35836 N Ash St
- 25873 W Laneville Dr
- 25881 W Laneville Dr
- 35895 N Ash St
- 35830 N Ash St
- 25833 W Laneville Dr
- 25856 W Highpoint Rd
- 25895 W Laneville Dr
- 35859 N Ash St
- 25851 W Laneville Dr
- 35913 N Ash St
- 25832 W Highpoint Rd
- 35933 N Ash St
- 35860 N Highpoint Ln
- 25868 W Highpoint Rd