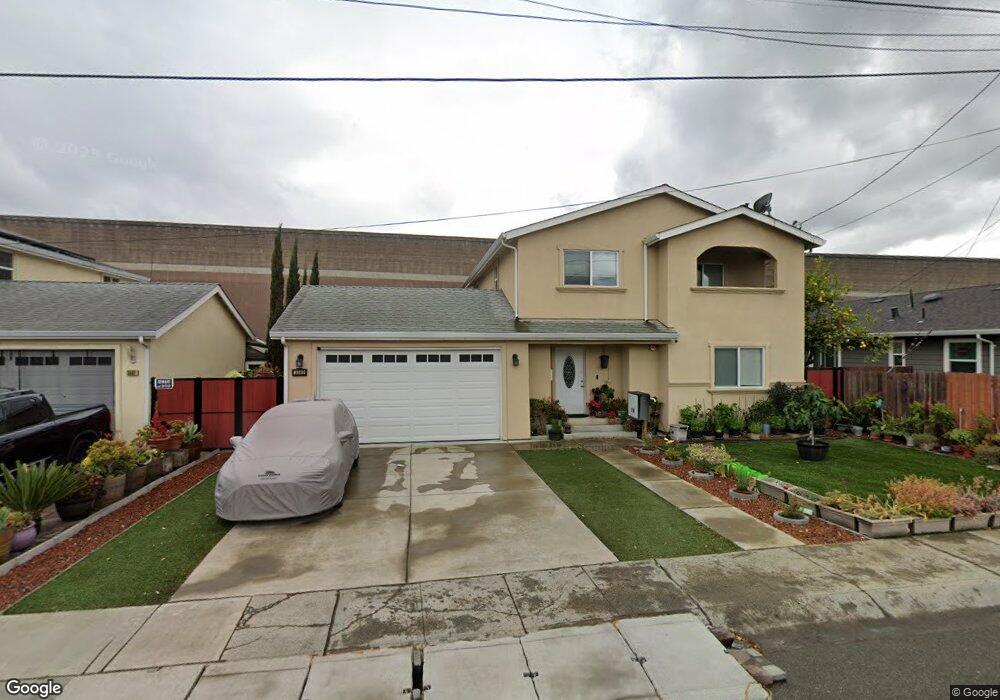
3589 Juniper St Castro Valley, CA 94546
Castro Valley East NeighborhoodEstimated Value: $1,114,000 - $1,307,000
4
Beds
3
Baths
1,904
Sq Ft
$627/Sq Ft
Est. Value
About This Home
This home is located at 3589 Juniper St, Castro Valley, CA 94546 and is currently estimated at $1,194,425, approximately $627 per square foot. 3589 Juniper St is a home located in Alameda County with nearby schools including Marshall Elementary School, Creekside Middle School, and Canyon Middle School.
Ownership History
Date
Name
Owned For
Owner Type
Purchase Details
Closed on
Feb 19, 2021
Sold by
Yu Shawn C and Yu Elizabeth Ai
Bought by
Yu Shawn Chi Hing and Yu Elizabeth Ai
Current Estimated Value
Home Financials for this Owner
Home Financials are based on the most recent Mortgage that was taken out on this home.
Original Mortgage
$401,000
Outstanding Balance
$327,204
Interest Rate
2.7%
Mortgage Type
New Conventional
Estimated Equity
$867,221
Purchase Details
Closed on
Sep 22, 2020
Sold by
Yu Elizabeth Ai-Ling and Yu Shawn C
Bought by
Shawn And Elizabeth Yu Trust and Yu
Purchase Details
Closed on
Aug 27, 2020
Sold by
Yu Elizabeth Ai Ling and Yu Shawn C
Bought by
Yu Shawn Chi Hong and Yu Elizabeth Ai
Purchase Details
Closed on
Apr 7, 2014
Sold by
Nazareth Teresa and The Nazareth Trust
Bought by
Yu Elizabeth Ai Ling and Yu Shawn C
Home Financials for this Owner
Home Financials are based on the most recent Mortgage that was taken out on this home.
Original Mortgage
$484,000
Interest Rate
2.87%
Mortgage Type
Adjustable Rate Mortgage/ARM
Create a Home Valuation Report for This Property
The Home Valuation Report is an in-depth analysis detailing your home's value as well as a comparison with similar homes in the area
Home Values in the Area
Average Home Value in this Area
Purchase History
| Date | Buyer | Sale Price | Title Company |
|---|---|---|---|
| Yu Shawn Chi Hing | -- | Accommodation | |
| Yu Shawn C | -- | Fidelity National Title Co | |
| Shawn And Elizabeth Yu Trust | -- | None Listed On Document | |
| Yu Shawn Chi Hong | -- | None Available | |
| Yu Elizabeth Ai Ling | $605,000 | North American Title Co Inc |
Source: Public Records
Mortgage History
| Date | Status | Borrower | Loan Amount |
|---|---|---|---|
| Open | Yu Shawn C | $401,000 | |
| Previous Owner | Yu Elizabeth Ai Ling | $484,000 |
Source: Public Records
Tax History Compared to Growth
Tax History
| Year | Tax Paid | Tax Assessment Tax Assessment Total Assessment is a certain percentage of the fair market value that is determined by local assessors to be the total taxable value of land and additions on the property. | Land | Improvement |
|---|---|---|---|---|
| 2025 | $9,325 | $734,614 | $183,871 | $557,743 |
| 2024 | $9,325 | $720,076 | $180,267 | $546,809 |
| 2023 | $9,174 | $712,823 | $176,733 | $536,090 |
| 2022 | $8,997 | $691,847 | $173,268 | $525,579 |
| 2021 | $8,766 | $678,150 | $169,872 | $515,278 |
| 2020 | $8,566 | $678,125 | $168,130 | $509,995 |
| 2019 | $8,723 | $664,834 | $164,835 | $499,999 |
| 2018 | $8,476 | $651,802 | $161,604 | $490,198 |
| 2017 | $8,253 | $639,025 | $158,436 | $480,589 |
| 2016 | $7,852 | $626,495 | $155,329 | $471,166 |
| 2015 | $7,311 | $617,087 | $152,997 | $464,090 |
| 2014 | $4,038 | $341,231 | $51,231 | $290,000 |
Source: Public Records
Map
Nearby Homes
- 3414 Pine St
- 3838 Norbridge Ave
- 21061 Story St
- 3826 Norbridge Ave
- 3710 Scribe Way
- Plan 1714 at The Chapter
- Plan 1582 at The Chapter
- Plan 1660 at The Chapter
- Plan 1606 at The Chapter
- Plan 1495 at The Chapter
- Plan 2033 at The Chapter
- Plan 1705 at The Chapter
- Plan 1423 Modeled at The Chapter
- Plan 1749 Modeled at The Chapter
- 3915 Novel Way
- 3767 Castro Valley Blvd
- 3769 Castro Valley Blvd
- 3775 Castro Valley Blvd
- 3824 Norbridge Ave
- 3913 Castro Valley Blvd Unit 39