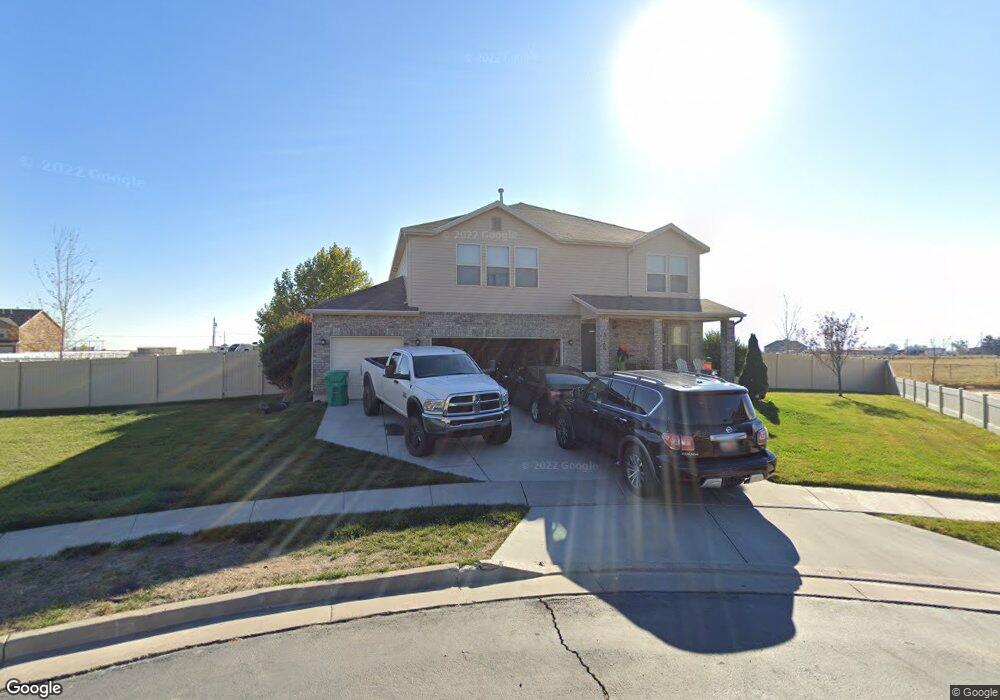
3589 W 2610 S Syracuse, UT 84075
Estimated Value: $535,000 - $594,766
3
Beds
3
Baths
2,632
Sq Ft
$215/Sq Ft
Est. Value
About This Home
This home is located at 3589 W 2610 S, Syracuse, UT 84075 and is currently estimated at $566,192, approximately $215 per square foot. 3589 W 2610 S is a home located in Davis County with nearby schools including Buffalo Point School, Syracuse Junior High School, and Syracuse High School.
Ownership History
Date
Name
Owned For
Owner Type
Purchase Details
Closed on
Oct 22, 2020
Sold by
Martinez Cory
Bought by
Martinez Cory and Martinez Kristy Leigh
Current Estimated Value
Home Financials for this Owner
Home Financials are based on the most recent Mortgage that was taken out on this home.
Original Mortgage
$238,500
Outstanding Balance
$191,595
Interest Rate
2.8%
Mortgage Type
New Conventional
Estimated Equity
$374,597
Purchase Details
Closed on
Mar 28, 2016
Sold by
Spackman Amber D
Bought by
Martinez Cory
Purchase Details
Closed on
Nov 13, 2007
Sold by
Fieldstone Homes Utah Llc
Bought by
Spackman Amber D and Spackman Perry
Home Financials for this Owner
Home Financials are based on the most recent Mortgage that was taken out on this home.
Original Mortgage
$246,137
Interest Rate
6.35%
Mortgage Type
FHA
Purchase Details
Closed on
Oct 3, 2006
Sold by
M & D Developers Llc
Bought by
Fieldstone Homes/Utah Llc
Create a Home Valuation Report for This Property
The Home Valuation Report is an in-depth analysis detailing your home's value as well as a comparison with similar homes in the area
Home Values in the Area
Average Home Value in this Area
Purchase History
| Date | Buyer | Sale Price | Title Company |
|---|---|---|---|
| Martinez Cory | -- | Pinnacle Title | |
| Martinez Cory | -- | North American Title | |
| Spackman Amber D | -- | Bonneville Superior Title Co | |
| Fieldstone Homes/Utah Llc | -- | Heritage West Title Ins Agen |
Source: Public Records
Mortgage History
| Date | Status | Borrower | Loan Amount |
|---|---|---|---|
| Open | Martinez Cory | $238,500 | |
| Previous Owner | Spackman Amber D | $246,137 |
Source: Public Records
Tax History Compared to Growth
Tax History
| Year | Tax Paid | Tax Assessment Tax Assessment Total Assessment is a certain percentage of the fair market value that is determined by local assessors to be the total taxable value of land and additions on the property. | Land | Improvement |
|---|---|---|---|---|
| 2025 | $3,021 | $291,500 | $123,183 | $168,317 |
| 2024 | $2,916 | $283,250 | $105,421 | $177,829 |
| 2023 | $2,712 | $480,000 | $152,074 | $327,926 |
| 2022 | $2,925 | $283,800 | $80,225 | $203,575 |
| 2021 | $2,583 | $388,000 | $116,448 | $271,552 |
| 2020 | $2,262 | $329,000 | $98,498 | $230,502 |
| 2019 | $2,201 | $316,000 | $100,045 | $215,955 |
| 2018 | $2,000 | $285,000 | $95,856 | $189,144 |
| 2016 | $1,737 | $129,800 | $38,025 | $91,775 |
| 2015 | $1,712 | $121,825 | $38,025 | $83,800 |
| 2014 | $1,706 | $123,763 | $38,025 | $85,738 |
| 2013 | -- | $121,625 | $35,324 | $86,301 |
Source: Public Records
Map
Nearby Homes
- 3360 W 2280 S
- 3704 W 2170 S Unit 111
- 2961 S 2425 W Unit 1123
- 2524 S 3590 W Unit 602
- 2965 S 3000 W
- 2971 S 2425 W Unit 1124
- 2686 S 2440 W Unit 101
- 2635 S 2430 W Unit 114
- 3062 W Solace St
- 2735 S Shoreline Dr
- 2696 2495 S Unit 207
- 2983 W North Shore Dr
- 3022 S Shoreline Dr
- 3006 S 2725 W
- 2982 S 3000 W
- 2912 S 3000 W
- 3062 S 2675 W
- 2996 S 2550 W
- 2975 S 2550 W
- 2574 S 2430 W Unit 503