359 Blake Ridge Ct Thousand Oaks, CA 91361
Estimated Value: $2,521,346 - $3,285,000
5
Beds
4
Baths
3,959
Sq Ft
$694/Sq Ft
Est. Value
About This Home
This home is located at 359 Blake Ridge Ct, Thousand Oaks, CA 91361 and is currently estimated at $2,747,087, approximately $693 per square foot. 359 Blake Ridge Ct is a home located in Ventura County with nearby schools including Conejo Elementary School, Colina Middle School, and Westlake High School.
Ownership History
Date
Name
Owned For
Owner Type
Purchase Details
Closed on
Feb 27, 2019
Sold by
Zhang Minghuang and Zhang Lucy Zhou
Bought by
Zhang Minghuang and Zhang Lucy Zhou
Current Estimated Value
Purchase Details
Closed on
Feb 22, 2007
Sold by
Wade Troy J and Wade Joanne B
Bought by
Zhang Minghuang and Zhang Lucy Zhou
Home Financials for this Owner
Home Financials are based on the most recent Mortgage that was taken out on this home.
Original Mortgage
$88,000
Outstanding Balance
$53,353
Interest Rate
6.29%
Mortgage Type
Credit Line Revolving
Estimated Equity
$2,693,734
Purchase Details
Closed on
Aug 29, 2004
Sold by
Centex Homes
Bought by
Wade Troy J and Wade Joanne B
Home Financials for this Owner
Home Financials are based on the most recent Mortgage that was taken out on this home.
Original Mortgage
$1,000,000
Interest Rate
5.62%
Mortgage Type
New Conventional
Purchase Details
Closed on
Dec 4, 2003
Sold by
West Pointe Homes Inc
Bought by
Centex Homes
Create a Home Valuation Report for This Property
The Home Valuation Report is an in-depth analysis detailing your home's value as well as a comparison with similar homes in the area
Home Values in the Area
Average Home Value in this Area
Purchase History
| Date | Buyer | Sale Price | Title Company |
|---|---|---|---|
| Zhang Minghuang | -- | None Available | |
| Zhang Minghuang | $1,359,000 | Commerce Title | |
| Wade Troy J | $1,385,000 | Commerce Title Company | |
| Centex Homes | -- | Lawyers Title Company |
Source: Public Records
Mortgage History
| Date | Status | Borrower | Loan Amount |
|---|---|---|---|
| Open | Zhang Minghuang | $88,000 | |
| Open | Zhang Minghuang | $999,000 | |
| Previous Owner | Wade Troy J | $1,000,000 | |
| Closed | Wade Troy J | $246,400 |
Source: Public Records
Tax History Compared to Growth
Tax History
| Year | Tax Paid | Tax Assessment Tax Assessment Total Assessment is a certain percentage of the fair market value that is determined by local assessors to be the total taxable value of land and additions on the property. | Land | Improvement |
|---|---|---|---|---|
| 2025 | $21,345 | $2,031,310 | $1,183,700 | $847,610 |
| 2024 | $21,345 | $1,991,481 | $1,160,490 | $830,991 |
| 2023 | $20,779 | $1,952,433 | $1,137,735 | $814,698 |
| 2022 | $20,425 | $1,914,150 | $1,115,426 | $798,724 |
| 2021 | $15,630 | $1,452,000 | $953,000 | $499,000 |
| 2020 | $14,749 | $1,406,000 | $923,000 | $483,000 |
| 2019 | $14,032 | $1,347,000 | $884,000 | $463,000 |
| 2018 | $14,722 | $1,414,000 | $928,000 | $486,000 |
| 2017 | $15,775 | $1,515,000 | $994,000 | $521,000 |
| 2016 | $16,226 | $1,542,000 | $1,012,000 | $530,000 |
| 2015 | $12,850 | $1,224,000 | $803,000 | $421,000 |
| 2014 | $13,098 | $1,241,000 | $814,000 | $427,000 |
Source: Public Records
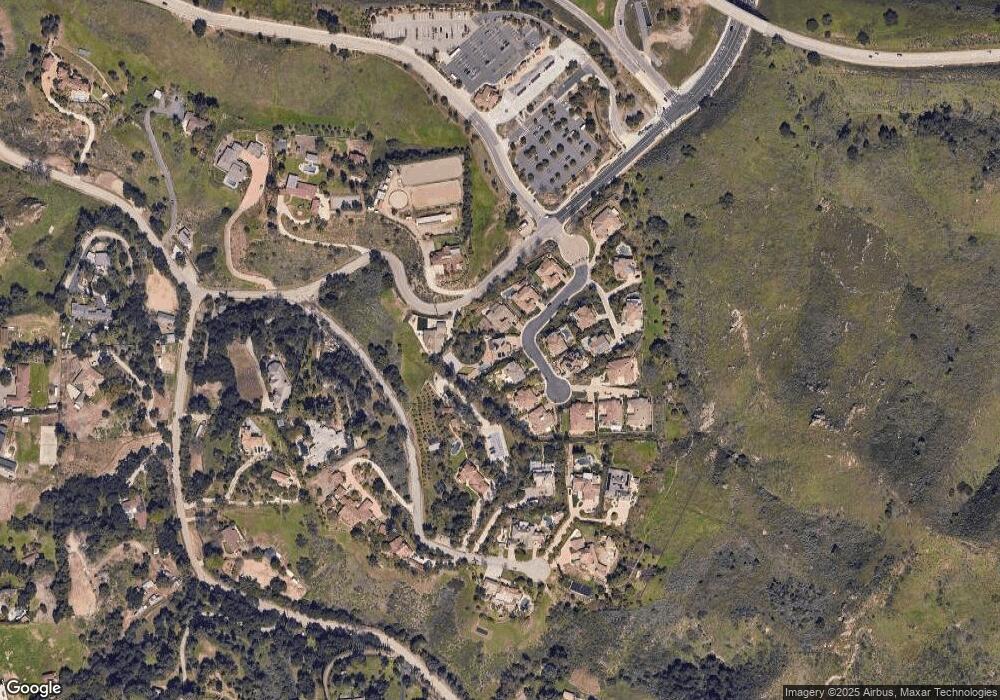
Map
Nearby Homes
- 1000 E Thousand Oaks Blvd
- 163 Houston Dr
- 1710 E Thousand Oaks Blvd
- 62 Maegan Place Unit 4
- 110 Maegan Place Unit 13
- 68 Maegan Place Unit 7
- 245 Houston Dr
- 56 Maegan Place Unit 4
- 1342 E Hillcrest Dr Unit 20
- 978 Bower Way
- 1340 E Hillcrest Dr Unit 8
- 86 Maegan Place Unit 4
- 96 Erbes Rd
- 139 Los Padres Dr
- 647 Brossard Dr
- 170 Erbes Rd
- 918 Rancho Rd
- 566 Rancho Rd
- 2394 Pleasant Way Unit J
- 353 Blake Ridge Ct
- 365 Blake Ridge Ct
- 347 Blake Ridge Ct
- 371 Blake Ridge Ct
- 348 Blake Ridge Ct
- 0 Rimrock Unit 80014835
- 0 Rimrock Unit F1776465
- 0 Rimrock Unit SR18003613
- 0 Rimrock Unit F1839540
- 0 Rimrock Unit SR15252269
- 0 Rimrock Unit SR15252262
- 0 Rimrock Unit V0-10012052
- 0 Rimrock Unit V0-11016200
- 0 Rimrock Unit 13000582
- 0 Rimrock Unit V0-80014835
- 140 Rimrock Rd
- 354 Blake Ridge Ct
- 377 Blake Ridge Ct
- 342 Blake Ridge Ct
- 378 Blake Ridge Ct