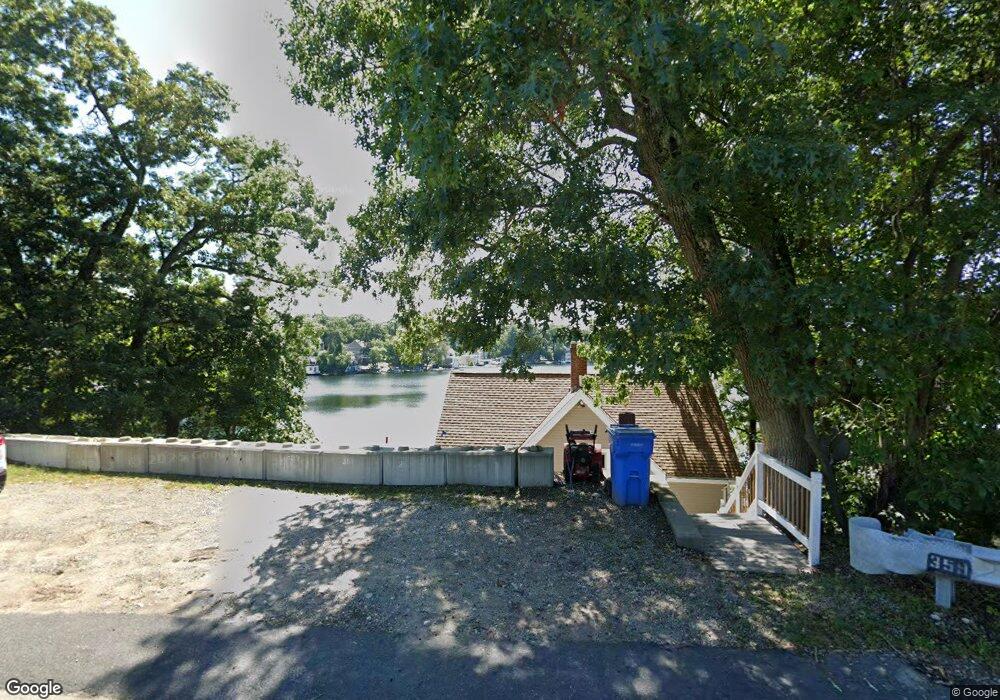
359 Franklin St Wrentham, MA 02093
Estimated Value: $750,000 - $909,000
4
Beds
2
Baths
1,618
Sq Ft
$524/Sq Ft
Est. Value
About This Home
This home is located at 359 Franklin St, Wrentham, MA 02093 and is currently estimated at $847,548, approximately $523 per square foot. 359 Franklin St is a home located in Norfolk County with nearby schools including Delaney Elementary School and Charles E Roderick.
Ownership History
Date
Name
Owned For
Owner Type
Purchase Details
Closed on
Jun 15, 2021
Sold by
Riley John J and Riley Kathleen A
Bought by
Gilmore Robert G and Gilmore Megan S
Current Estimated Value
Home Financials for this Owner
Home Financials are based on the most recent Mortgage that was taken out on this home.
Original Mortgage
$485,000
Outstanding Balance
$439,107
Interest Rate
2.9%
Mortgage Type
Purchase Money Mortgage
Estimated Equity
$408,441
Purchase Details
Closed on
Jul 29, 2014
Sold by
Riley John J
Bought by
Riley John J and Riley Kathleen A
Home Financials for this Owner
Home Financials are based on the most recent Mortgage that was taken out on this home.
Original Mortgage
$603,000
Interest Rate
3%
Mortgage Type
Adjustable Rate Mortgage/ARM
Purchase Details
Closed on
Dec 1, 1993
Sold by
Harrison Jean E
Bought by
Riley John J
Home Financials for this Owner
Home Financials are based on the most recent Mortgage that was taken out on this home.
Original Mortgage
$95,600
Interest Rate
6.69%
Mortgage Type
Purchase Money Mortgage
Create a Home Valuation Report for This Property
The Home Valuation Report is an in-depth analysis detailing your home's value as well as a comparison with similar homes in the area
Purchase History
| Date | Buyer | Sale Price | Title Company |
|---|---|---|---|
| Gilmore Robert G | $750,000 | None Available | |
| Riley John J | -- | -- | |
| Riley John J | $127,500 | -- |
Source: Public Records
Mortgage History
| Date | Status | Borrower | Loan Amount |
|---|---|---|---|
| Open | Gilmore Robert G | $485,000 | |
| Previous Owner | Riley John J | $603,000 | |
| Previous Owner | Riley John J | $117,000 | |
| Previous Owner | Riley John J | $50,000 | |
| Previous Owner | Riley John J | $95,600 |
Source: Public Records
Tax History
| Year | Tax Paid | Tax Assessment Tax Assessment Total Assessment is a certain percentage of the fair market value that is determined by local assessors to be the total taxable value of land and additions on the property. | Land | Improvement |
|---|---|---|---|---|
| 2025 | $7,982 | $688,700 | $410,400 | $278,300 |
| 2024 | $7,698 | $641,500 | $410,400 | $231,100 |
| 2023 | $7,466 | $591,600 | $373,100 | $218,500 |
| 2022 | $5,536 | $405,000 | $331,200 | $73,800 |
| 2021 | $5,107 | $363,000 | $294,000 | $69,000 |
| 2020 | $6,058 | $425,100 | $320,600 | $104,500 |
| 2019 | $6,278 | $444,600 | $345,300 | $99,300 |
| 2018 | $6,751 | $474,100 | $346,800 | $127,300 |
| 2017 | $6,613 | $464,100 | $340,100 | $124,000 |
| 2016 | $6,452 | $451,800 | $330,200 | $121,600 |
| 2015 | $6,420 | $428,600 | $317,500 | $111,100 |
| 2014 | $6,573 | $429,300 | $322,300 | $107,000 |
Source: Public Records
Map
Nearby Homes
- 500 Franklin St
- 287 Park St
- 10 Nature View Dr
- 15 Nature View Dr
- 50 Reed Fulton Ave Unit Lot 61
- 246 Forest Grove Ave
- 45 Joshua Rd
- 11 Earle Stewart Ln
- 12 Earle Stewart Ln
- Lot 1 - Blueberry 2 Car Plan at King Philip Estates
- Lot 8 - Blueberry 2 Car Plan at King Philip Estates
- Lot 5 - Hughes 2 car Plan at King Philip Estates
- Lot 6 - Blueberry 3 Car Plan at King Philip Estates
- 10 Earle Stewart Ln Unit Lot 5
- Lot 2 - Camden 2 Car Plan at King Philip Estates
- Lot 7 - Cedar Plan at King Philip Estates
- Lot 4 - Hemingway 2 Car Plan at King Philip Estates
- 14 Earle Stewart Ln
- Lot 3 - Blueberry 2 Car Plan at King Philip Estates
- 557 Dedham St
- 369 Franklin St
- 331 Franklin St
- 371 Franklin St
- 377 Franklin St
- 366 Franklin St
- 356 Franklin St
- 372 Franklin St
- 348 Franklin St
- 380 Franklin St
- 317 Franklin St
- 383 Franklin St
- 340 Franklin St
- 388 Franklin St
- 315 Franklin St
- 391 Franklin St
- 394 Franklin St
- 313 Franklin St
- 400 Franklin St
- 332 Franklin St
- 311 Franklin St
Your Personal Tour Guide
Ask me questions while you tour the home.