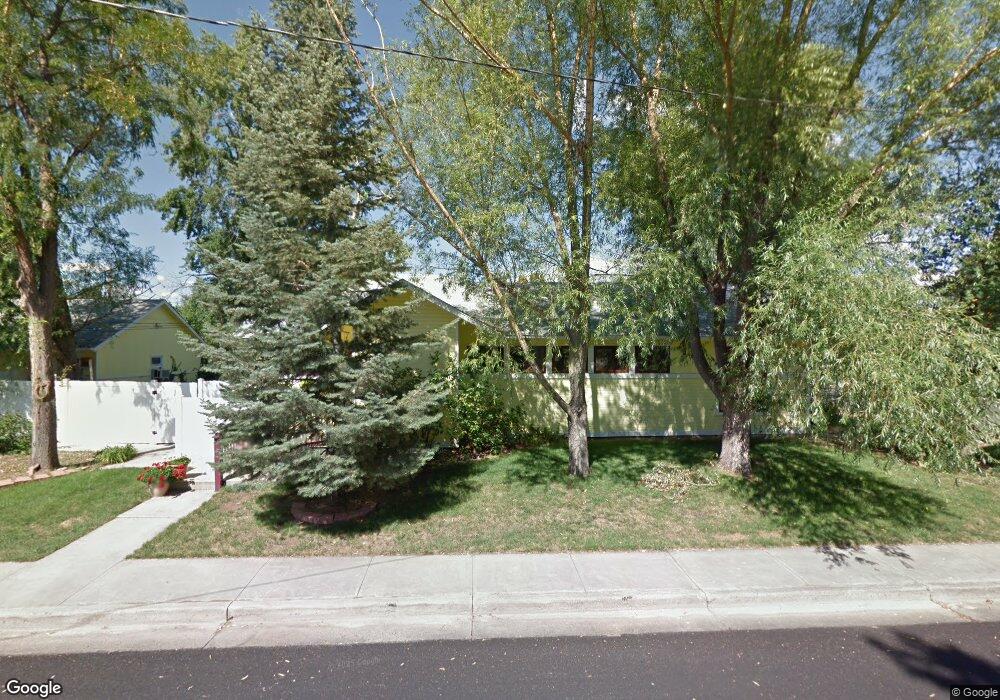
359 N Franklin Ave Loveland, CO 80537
Estimated Value: $448,499 - $530,000
4
Beds
1
Bath
1,322
Sq Ft
$366/Sq Ft
Est. Value
About This Home
This home is located at 359 N Franklin Ave, Loveland, CO 80537 and is currently estimated at $483,375, approximately $365 per square foot. 359 N Franklin Ave is a home located in Larimer County with nearby schools including Garfield Elementary School, Bill Reed Middle School, and Loveland High School.
Ownership History
Date
Name
Owned For
Owner Type
Purchase Details
Closed on
Mar 31, 1999
Sold by
Fleming John A and Fleming Merry M
Bought by
Bublitz Edward G and Bublitz Cynthia S
Current Estimated Value
Home Financials for this Owner
Home Financials are based on the most recent Mortgage that was taken out on this home.
Original Mortgage
$130,000
Outstanding Balance
$32,508
Interest Rate
6.89%
Estimated Equity
$450,867
Purchase Details
Closed on
Dec 15, 1997
Sold by
Wiltgen Marilyn L Robert L
Bought by
Fleming John A and Fleming Merry M
Home Financials for this Owner
Home Financials are based on the most recent Mortgage that was taken out on this home.
Original Mortgage
$74,900
Interest Rate
7.22%
Purchase Details
Closed on
Nov 1, 1993
Sold by
Kamtz Jeffery L
Bought by
Wiltgen Marilyn L
Create a Home Valuation Report for This Property
The Home Valuation Report is an in-depth analysis detailing your home's value as well as a comparison with similar homes in the area
Home Values in the Area
Average Home Value in this Area
Purchase History
| Date | Buyer | Sale Price | Title Company |
|---|---|---|---|
| Bublitz Edward G | $162,500 | -- | |
| Fleming John A | $149,900 | -- | |
| Wiltgen Marilyn L | $95,000 | -- |
Source: Public Records
Mortgage History
| Date | Status | Borrower | Loan Amount |
|---|---|---|---|
| Open | Bublitz Edward G | $130,000 | |
| Previous Owner | Fleming John A | $74,900 |
Source: Public Records
Tax History Compared to Growth
Tax History
| Year | Tax Paid | Tax Assessment Tax Assessment Total Assessment is a certain percentage of the fair market value that is determined by local assessors to be the total taxable value of land and additions on the property. | Land | Improvement |
|---|---|---|---|---|
| 2025 | $1,571 | $30,070 | $3,484 | $26,586 |
| 2024 | $1,515 | $30,070 | $3,484 | $26,586 |
| 2022 | $1,177 | $21,747 | $3,614 | $18,133 |
| 2021 | $1,210 | $22,372 | $3,718 | $18,654 |
| 2020 | $1,258 | $22,973 | $3,718 | $19,255 |
| 2019 | $1,237 | $22,973 | $3,718 | $19,255 |
| 2018 | $1,671 | $20,304 | $3,744 | $16,560 |
| 2017 | $1,439 | $20,304 | $3,744 | $16,560 |
| 2016 | $1,375 | $18,754 | $4,139 | $14,615 |
| 2015 | $1,364 | $18,750 | $4,140 | $14,610 |
| 2014 | $1,175 | $15,630 | $4,140 | $11,490 |
Source: Public Records
Map
Nearby Homes
- 610 W 5th St
- 633 W 6th St
- 914 W 6th St
- 680 Colorado Ave
- 610 California Ave
- 721 Sheridan Ave
- 720 Roosevelt Ave
- 625 Harrison Ave
- 604 W 9th St
- 143 W 2nd St
- 1330 W 6th St
- 905 Harrison Ave
- 643 W 10th St
- 1016 Winona Cir
- 108 S Cleveland Ave
- 205 E 6th St Unit 400
- 205 E 6th St Unit 302
- 205 E 6th St Unit 200
- 205 E 6th St Unit 205
- 205 E 6th St Unit 301