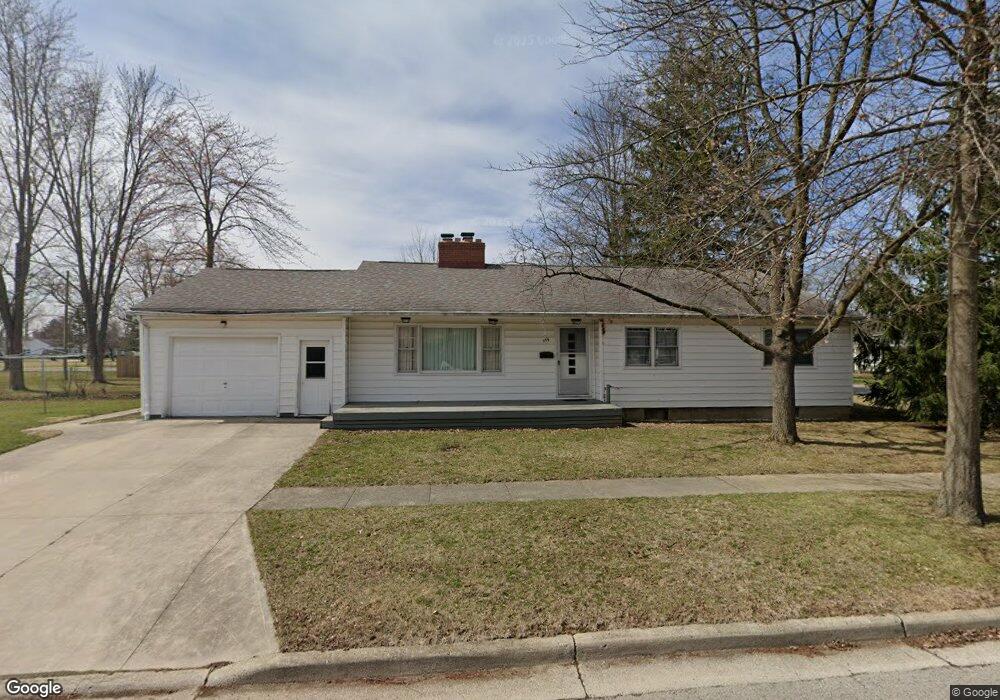
359 N Hall St Ottawa, OH 45875
Estimated Value: $174,756 - $208,000
4
Beds
2
Baths
1,528
Sq Ft
$125/Sq Ft
Est. Value
About This Home
This home is located at 359 N Hall St, Ottawa, OH 45875 and is currently estimated at $190,689, approximately $124 per square foot. 359 N Hall St is a home located in Putnam County with nearby schools including Ottawa-Glandorf High School and Sts. Peter & Paul Catholic School.
Ownership History
Date
Name
Owned For
Owner Type
Purchase Details
Closed on
May 20, 2024
Sold by
Loman William A and Loman Kimberly
Bought by
Lockwood Lynda S
Current Estimated Value
Purchase Details
Closed on
May 18, 2024
Sold by
Loman Thomas J and Loman Sarah
Bought by
Lockwood Lynda S
Purchase Details
Closed on
May 15, 2024
Sold by
Loman Teresa K and Hunter Stephen
Bought by
Lockwood Lynda S
Purchase Details
Closed on
May 14, 2024
Sold by
Leibe Amy L and Leibe Dennis
Bought by
Lockwood Lynda S
Purchase Details
Closed on
May 1, 2023
Sold by
Loman Robert J
Bought by
Loman Robert J and Leibe Amy L
Purchase Details
Closed on
Jun 30, 2006
Sold by
Ruhe Constance S
Bought by
Loman Robert J
Home Financials for this Owner
Home Financials are based on the most recent Mortgage that was taken out on this home.
Original Mortgage
$30,000
Interest Rate
6.72%
Mortgage Type
Purchase Money Mortgage
Create a Home Valuation Report for This Property
The Home Valuation Report is an in-depth analysis detailing your home's value as well as a comparison with similar homes in the area
Home Values in the Area
Average Home Value in this Area
Purchase History
| Date | Buyer | Sale Price | Title Company |
|---|---|---|---|
| Lockwood Lynda S | $34,800 | None Listed On Document | |
| Lockwood Lynda S | $34,800 | None Listed On Document | |
| Lockwood Lynda S | $34,800 | None Listed On Document | |
| Lockwood Lynda S | $34,800 | None Listed On Document | |
| Loman Robert J | -- | None Listed On Document | |
| Loman Robert J | $10,000 | None Available |
Source: Public Records
Mortgage History
| Date | Status | Borrower | Loan Amount |
|---|---|---|---|
| Previous Owner | Loman Robert J | $800,000 | |
| Previous Owner | Loman Robert J | $44,500 | |
| Previous Owner | Loman Robert J | $30,000 |
Source: Public Records
Tax History Compared to Growth
Tax History
| Year | Tax Paid | Tax Assessment Tax Assessment Total Assessment is a certain percentage of the fair market value that is determined by local assessors to be the total taxable value of land and additions on the property. | Land | Improvement |
|---|---|---|---|---|
| 2024 | $1,542 | $48,980 | $5,030 | $43,950 |
| 2023 | $1,589 | $39,690 | $3,910 | $35,780 |
| 2022 | $1,461 | $39,691 | $3,910 | $35,781 |
| 2021 | $1,468 | $39,690 | $3,910 | $35,780 |
| 2020 | $1,476 | $32,200 | $3,490 | $28,710 |
| 2019 | $1,226 | $32,830 | $3,910 | $28,920 |
| 2018 | $1,207 | $32,830 | $3,910 | $28,920 |
| 2017 | $1,217 | $32,830 | $3,910 | $28,920 |
| 2016 | $1,172 | $32,200 | $3,490 | $28,710 |
| 2015 | $1,181 | $32,200 | $3,490 | $28,710 |
| 2014 | $1,164 | $32,200 | $3,490 | $28,710 |
| 2013 | $1,160 | $32,200 | $3,490 | $28,710 |
Source: Public Records
Map
Nearby Homes
- 740 E Main St
- 443 E 4th St
- 717 E 2nd St
- 1006 E 2nd St
- 370 S Thomas St
- 1417 E 3rd St
- 530 N Taft Ave
- 1709 S Agner St
- 0 Sapphire St Unit 225029940
- 445 S Oak St
- 717 & 717 1/2 & 721 E Third St
- 304 Oakview (Unit E) Dr
- 1854 S Agner St
- 195 Eastland Dr
- #11 Oakview Dr
- #10 Oakview Dr
- #9 Oakview Dr
- #8 Oakview Dr
- #7 Oakview Dr
- #6 Oakview Dr