
Seller's Agent in 2022
Pamela Fernberg
Coldwell Banker Realty
(203) 209-7306
1 in this area
57 Total Sales
Estimated Value: $474,000 - $605,000
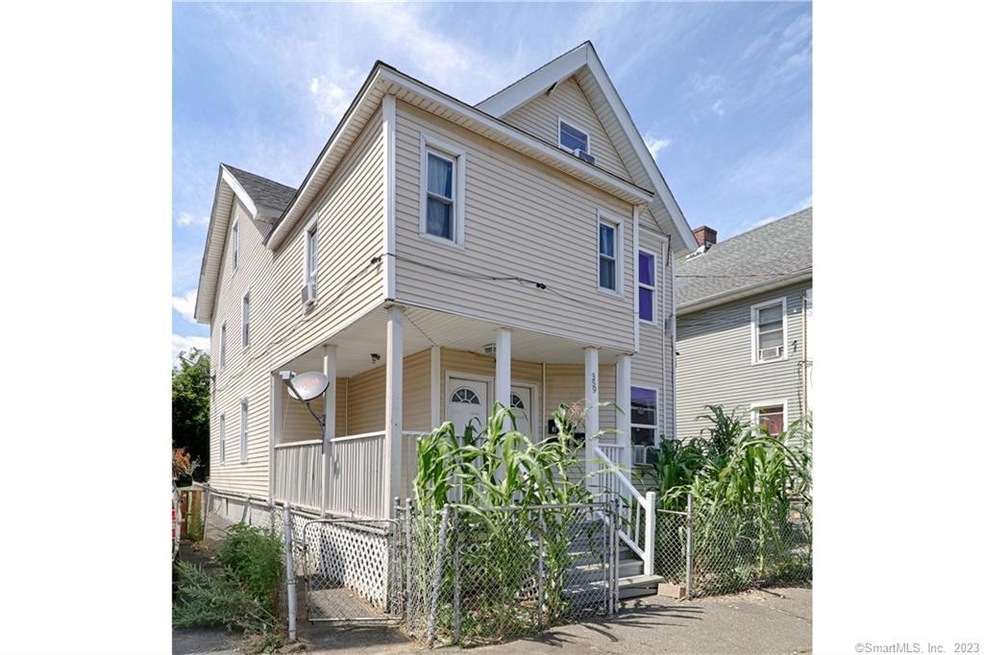
Spacious three-family home, fully rented. Home is updated throughout and in excellent condition. First and second floor units are 3-bedroom apartments. 3rd floor is a one-bedroom unit. Great investment opportunity! Or live in one unit and rent out the others. Long-term tenants with leases on first and second floors, third floor is month-to-month. Full unfinished basement. Gas heat. Convenient location close to bus lines, shopping, highways, MetroNorth train to NYC. As is.
Last Agent to Sell the Property
Coldwell Banker Realty License #RES.0752942 Listed on: 07/31/2022
| Date | Buyer | Sale Price | Title Company |
|---|---|---|---|
| Prietley Radeshia | $355,000 | None Available | |
| Prietley Radeshia | $355,000 | None Available | |
| Aracena Jesus | $250,100 | None Available | |
| Aracena Jesus | $250,100 | None Available | |
| Nelson Moses | -- | -- | |
| Nelson Moses | -- | -- | |
| Department Of Housing & Urban Dev | -- | -- | |
| Department Of Housing & Urban Dev | -- | -- | |
| Suntrust Mtg | -- | -- | |
| Suntrust Mtg | -- | -- | |
| Watt Alecia | $275,000 | -- | |
| Watt Alecia | $275,000 | -- |
| Date | Status | Borrower | Loan Amount |
|---|---|---|---|
| Open | Prietley Radeshia | $332,315 | |
| Closed | Prietley Radeshia | $332,315 | |
| Previous Owner | Aracena Jesus | $187,575 | |
| Previous Owner | Watt Alecia | $130,000 | |
| Previous Owner | Watt Alecia | $270,751 |
| Date | Event | Price | List to Sale | Price per Sq Ft | Prior Sale |
|---|---|---|---|---|---|
| 10/07/2022 10/07/22 | Sold | $355,000 | -5.3% | $130 / Sq Ft | |
| 10/06/2022 10/06/22 | Pending | -- | -- | -- | |
| 07/31/2022 07/31/22 | For Sale | $375,000 | +50.0% | $137 / Sq Ft | |
| 02/21/2020 02/21/20 | Sold | $250,000 | 0.0% | $91 / Sq Ft | View Prior Sale |
| 12/16/2019 12/16/19 | Pending | -- | -- | -- | |
| 12/12/2019 12/12/19 | For Sale | $250,000 | +2172.7% | $91 / Sq Ft | |
| 11/19/2013 11/19/13 | Sold | $11,000 | +11.1% | $4 / Sq Ft | View Prior Sale |
| 10/20/2013 10/20/13 | Pending | -- | -- | -- | |
| 09/14/2013 09/14/13 | For Sale | $9,900 | -- | $4 / Sq Ft |
| Year | Tax Paid | Tax Assessment Tax Assessment Total Assessment is a certain percentage of the fair market value that is determined by local assessors to be the total taxable value of land and additions on the property. | Land | Improvement |
|---|---|---|---|---|
| 2025 | $6,623 | $152,420 | $33,970 | $118,450 |
| 2024 | $6,623 | $152,420 | $33,970 | $118,450 |
| 2023 | $6,475 | $149,030 | $33,970 | $115,060 |
| 2022 | $7,396 | $170,210 | $33,970 | $136,240 |
| 2021 | $7,396 | $170,210 | $33,970 | $136,240 |
| 2020 | $6,550 | $121,310 | $16,090 | $105,220 |
| 2019 | $6,550 | $121,310 | $16,090 | $105,220 |
| 2018 | $6,596 | $121,310 | $16,090 | $105,220 |
| 2017 | $6,596 | $121,310 | $16,090 | $105,220 |
| 2016 | $6,596 | $121,310 | $16,090 | $105,220 |
| 2015 | $6,104 | $144,650 | $33,500 | $111,150 |
| 2014 | $6,104 | $144,650 | $33,500 | $111,150 |
Seller's Agent in 2022
Pamela Fernberg
Coldwell Banker Realty
(203) 209-7306
1 in this area
57 Total Sales
M
Buyer's Agent in 2022
Momodou Savage
Door to Door Real Estate
1 in this area
21 Total Sales
R
Seller's Agent in 2013
Raul Villacis
ARG Advisors
(203) 249-1248
6 Total Sales
C
Buyer's Agent in 2013
Charmaine Moore
Keller Williams Realty Prtnrs.
(203) 913-5293
1 in this area
8 Total Sales
Source: SmartMLS
MLS Number: 170511702
APN: BRID-001035-000003
Disclaimer: Certain information contained herein is derived from information provided by parties other than Homes.com. All information provided is deemed reliable, but is not guaranteed to be accurate and should be independently verified.
![]() IDX information is provided exclusively for personal, non-commercial use, and may not be used for any purpose other than to identify prospective properties consumers may be interested in purchasing. Information is deemed reliable but not guaranteed.
IDX information is provided exclusively for personal, non-commercial use, and may not be used for any purpose other than to identify prospective properties consumers may be interested in purchasing. Information is deemed reliable but not guaranteed.