
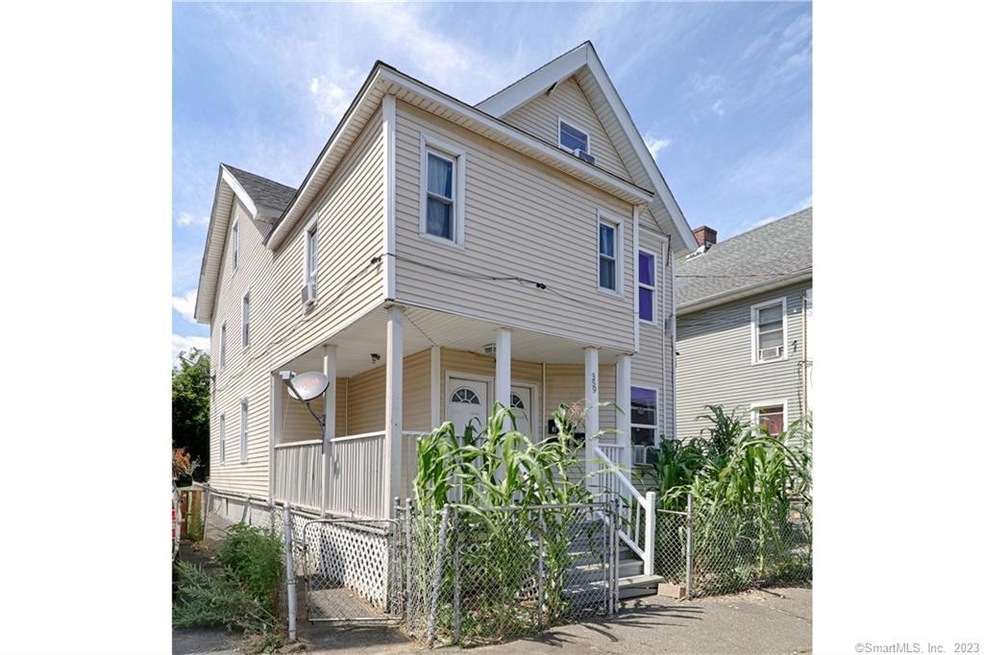
359 Olive St Unit 361 Bridgeport, CT 06604
The Hollow Neighborhood
7
Beds
3
Baths
2,734
Sq Ft
3,049
Sq Ft Lot
Highlights
- Public Water Access
- Porch
- Level Lot
- No HOA
- Property is near shops
About This Home
As of October 2022Spacious three-family home, fully rented. Home is updated throughout and in excellent condition. First and second floor units are 3-bedroom apartments. 3rd floor is a one-bedroom unit. Great investment opportunity! Or live in one unit and rent out the others. Long-term tenants with leases on first and second floors, third floor is month-to-month. Full unfinished basement. Gas heat. Convenient location close to bus lines, shopping, highways, MetroNorth train to NYC. As is.
Last Agent to Sell the Property
Coldwell Banker Realty License #RES.0752942 Listed on: 07/31/2022
Property Details
Home Type
- Multi-Family
Est. Annual Taxes
- $7,396
Year Built
- Built in 1897
Lot Details
- 3,049 Sq Ft Lot
- Level Lot
Parking
- On-Street Parking
Home Design
- Concrete Foundation
- Frame Construction
- Asphalt Shingled Roof
- Vinyl Siding
Interior Spaces
- 2,734 Sq Ft Home
- Unfinished Basement
- Basement Fills Entire Space Under The House
Bedrooms and Bathrooms
- 7 Bedrooms
- 3 Full Bathrooms
Outdoor Features
- Public Water Access
- Porch
Location
- Property is near shops
- Property is near a bus stop
Utilities
- Heating System Uses Gas
- Heating System Uses Natural Gas
Community Details
- No Home Owners Association
- 3 Units
Ownership History
Date
Name
Owned For
Owner Type
Purchase Details
Listed on
Jul 31, 2022
Closed on
Oct 7, 2022
Sold by
Aracena Jesus E and Aracena Aracena-Eudeirys J
Bought by
Prietley Radeshia
Seller's Agent
Pamela Fernberg
Coldwell Banker Realty
Buyer's Agent
Momodou Savage
Door to Door Real Estate
List Price
$375,000
Sold Price
$355,000
Premium/Discount to List
-$20,000
-5.33%
Views
68
Current Estimated Value
Home Financials for this Owner
Home Financials are based on the most recent Mortgage that was taken out on this home.
Estimated Appreciation
$126,928
Avg. Annual Appreciation
11.54%
Original Mortgage
$332,315
Outstanding Balance
$319,501
Interest Rate
5.55%
Mortgage Type
FHA
Estimated Equity
$162,427
Purchase Details
Listed on
Dec 12, 2019
Closed on
Jan 24, 2020
Sold by
Nelson Moses
Bought by
Aracena Jesus and Aracena Eudeirys
Seller's Agent
Momodou Savage
Door to Door Real Estate
Buyer's Agent
Pamela Fernberg
Coldwell Banker Realty
List Price
$250,000
Sold Price
$250,000
Home Financials for this Owner
Home Financials are based on the most recent Mortgage that was taken out on this home.
Avg. Annual Appreciation
14.26%
Original Mortgage
$187,575
Interest Rate
3.6%
Mortgage Type
Purchase Money Mortgage
Purchase Details
Listed on
Sep 14, 2013
Closed on
Nov 21, 2013
Sold by
Suntrust Mortgage Inc
Bought by
Nelson Moses
Seller's Agent
Raul Villacis
ARG Advisors
Buyer's Agent
Charmaine Moore
Keller Williams Realty Prtnrs.
List Price
$9,900
Sold Price
$11,000
Premium/Discount to List
$1,100
11.11%
Home Financials for this Owner
Home Financials are based on the most recent Mortgage that was taken out on this home.
Avg. Annual Appreciation
64.70%
Purchase Details
Closed on
Nov 21, 2011
Sold by
Suntrust Mtg
Bought by
Department Of Housing & Urban Dev
Purchase Details
Closed on
Jul 21, 2010
Sold by
Watt Alecia
Bought by
Suntrust Mtg
Purchase Details
Closed on
May 18, 2007
Sold by
Hudson William and Hudson Wyoma
Bought by
Watt Alecia
Home Financials for this Owner
Home Financials are based on the most recent Mortgage that was taken out on this home.
Original Mortgage
$270,751
Interest Rate
6.18%
Similar Homes in Bridgeport, CT
Create a Home Valuation Report for This Property
The Home Valuation Report is an in-depth analysis detailing your home's value as well as a comparison with similar homes in the area
Home Values in the Area
Average Home Value in this Area
Purchase History
| Date | Type | Sale Price | Title Company |
|---|---|---|---|
| Warranty Deed | $355,000 | None Available | |
| Warranty Deed | $355,000 | None Available | |
| Warranty Deed | $250,100 | None Available | |
| Warranty Deed | $250,100 | None Available | |
| Warranty Deed | -- | -- | |
| Warranty Deed | -- | -- | |
| Warranty Deed | -- | -- | |
| Warranty Deed | -- | -- | |
| Foreclosure Deed | -- | -- | |
| Foreclosure Deed | -- | -- | |
| Warranty Deed | $275,000 | -- | |
| Warranty Deed | $275,000 | -- |
Source: Public Records
Mortgage History
| Date | Status | Loan Amount | Loan Type |
|---|---|---|---|
| Open | $332,315 | FHA | |
| Closed | $332,315 | FHA | |
| Previous Owner | $187,575 | Purchase Money Mortgage | |
| Previous Owner | $130,000 | Stand Alone Refi Refinance Of Original Loan | |
| Previous Owner | $270,751 | No Value Available |
Source: Public Records
Property History
| Date | Event | Price | Change | Sq Ft Price |
|---|---|---|---|---|
| 10/07/2022 10/07/22 | Sold | $355,000 | -5.3% | $130 / Sq Ft |
| 10/06/2022 10/06/22 | Pending | -- | -- | -- |
| 07/31/2022 07/31/22 | For Sale | $375,000 | +50.0% | $137 / Sq Ft |
| 02/21/2020 02/21/20 | Sold | $250,000 | 0.0% | $91 / Sq Ft |
| 12/16/2019 12/16/19 | Pending | -- | -- | -- |
| 12/12/2019 12/12/19 | For Sale | $250,000 | +2172.7% | $91 / Sq Ft |
| 11/19/2013 11/19/13 | Sold | $11,000 | +11.1% | $4 / Sq Ft |
| 10/20/2013 10/20/13 | Pending | -- | -- | -- |
| 09/14/2013 09/14/13 | For Sale | $9,900 | -- | $4 / Sq Ft |
Source: SmartMLS
Tax History Compared to Growth
Tax History
| Year | Tax Paid | Tax Assessment Tax Assessment Total Assessment is a certain percentage of the fair market value that is determined by local assessors to be the total taxable value of land and additions on the property. | Land | Improvement |
|---|---|---|---|---|
| 2025 | $6,623 | $152,420 | $33,970 | $118,450 |
| 2024 | $6,623 | $152,420 | $33,970 | $118,450 |
| 2023 | $6,475 | $149,030 | $33,970 | $115,060 |
| 2022 | $7,396 | $170,210 | $33,970 | $136,240 |
| 2021 | $7,396 | $170,210 | $33,970 | $136,240 |
| 2020 | $6,550 | $121,310 | $16,090 | $105,220 |
| 2019 | $6,550 | $121,310 | $16,090 | $105,220 |
| 2018 | $6,596 | $121,310 | $16,090 | $105,220 |
| 2017 | $6,596 | $121,310 | $16,090 | $105,220 |
| 2016 | $6,596 | $121,310 | $16,090 | $105,220 |
| 2015 | $6,104 | $144,650 | $33,500 | $111,150 |
| 2014 | $6,104 | $144,650 | $33,500 | $111,150 |
Source: Public Records
Agents Affiliated with this Home
-
Seller's Agent in 2022
Pamela Fernberg
Coldwell Banker Realty
(203) 209-7306
1 in this area
62 Total Sales
-
M
Buyer's Agent in 2022
Momodou Savage
Door to Door Real Estate
1 in this area
22 Total Sales
-
R
Seller's Agent in 2013
Raul Villacis
ARG Advisors
(203) 249-1248
7 Total Sales
-
C
Buyer's Agent in 2013
Charmaine Moore
Keller Williams Realty Prtnrs.
(203) 913-5293
1 in this area
10 Total Sales
Map
Source: SmartMLS
MLS Number: 170511702
APN: BRID-001035-000003
Disclaimer: Certain information contained herein is derived from information provided by parties other than Homes.com. All information provided is deemed reliable, but is not guaranteed to be accurate and should be independently verified.
![]() IDX information is provided exclusively for personal, non-commercial use, and may not be used for any purpose other than to identify prospective properties consumers may be interested in purchasing. Information is deemed reliable but not guaranteed.
IDX information is provided exclusively for personal, non-commercial use, and may not be used for any purpose other than to identify prospective properties consumers may be interested in purchasing. Information is deemed reliable but not guaranteed.
Nearby Homes
- 213 Pequonnock St
- 72 Harral Ave
- 106 Jones Ave
- 149 Milne St
- 127 Jones Ave
- 501 Pequonnock St
- 120 Milne St Unit 122
- 90 Olive St
- 57 Milne St Unit 59
- 45 Washington Place
- 1169 Iranistan Ave
- 542 Norman St
- 460 Lexington Ave Unit 201
- 191 Oak St
- 73 Atwater St
- 297 Laurel Ave
- 393 Laurel Ave Unit 409
- 485 Laurel Ave
- 103 Eaton St Unit 105
- 839 Park Ave