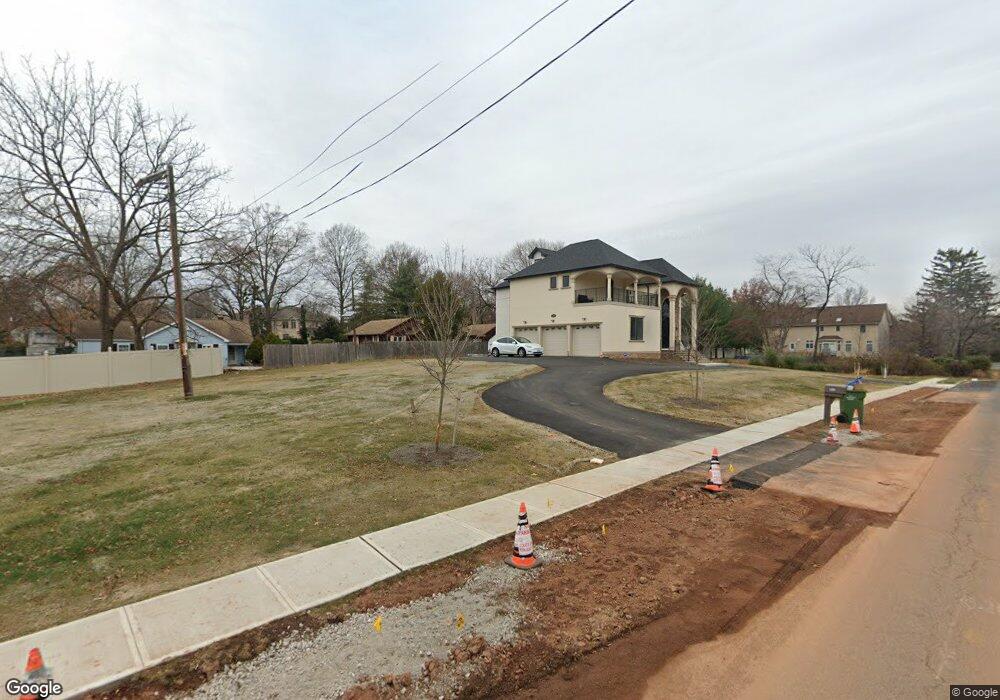
359 Rahway Rd Edison, NJ 08820
Estimated Value: $1,515,000 - $2,094,000
5
Beds
7
Baths
2,298
Sq Ft
$821/Sq Ft
Est. Value
About This Home
This home is located at 359 Rahway Rd, Edison, NJ 08820 and is currently estimated at $1,885,642, approximately $820 per square foot. 359 Rahway Rd is a home located in Middlesex County with nearby schools including Martin Luther King Elementary School, John Adams Middle School, and J.P. Stevens High School.
Ownership History
Date
Name
Owned For
Owner Type
Purchase Details
Closed on
Sep 3, 2024
Sold by
Pkg Builders Llc
Bought by
Perera Manoj S and Perera Diloshini V
Current Estimated Value
Home Financials for this Owner
Home Financials are based on the most recent Mortgage that was taken out on this home.
Original Mortgage
$1,596,000
Interest Rate
7%
Mortgage Type
New Conventional
Purchase Details
Closed on
May 3, 2023
Sold by
Pagoda Homes Llc
Bought by
Pkg Builders Llc
Purchase Details
Closed on
Nov 6, 2019
Sold by
Nguyen Daniel and Nguyen Fiona Mckie
Bought by
Pagoda Homes Llc
Purchase Details
Closed on
Jun 8, 2015
Sold by
Gieseke Karl G and Gieseke Ramona J
Bought by
Nguyen Paul
Purchase Details
Closed on
Jan 1, 2015
Sold by
Nguyen Paul
Bought by
Nguyen Daniel
Create a Home Valuation Report for This Property
The Home Valuation Report is an in-depth analysis detailing your home's value as well as a comparison with similar homes in the area
Home Values in the Area
Average Home Value in this Area
Purchase History
| Date | Buyer | Sale Price | Title Company |
|---|---|---|---|
| Perera Manoj S | $1,995,000 | Chicago Title | |
| Perera Manoj S | $1,995,000 | Chicago Title | |
| Pkg Builders Llc | $575,000 | None Listed On Document | |
| Pagoda Homes Llc | $490,000 | None Available | |
| Nguyen Paul | $320,000 | Multiple | |
| Nguyen Daniel | -- | Chicago Title Insurance Comp |
Source: Public Records
Mortgage History
| Date | Status | Borrower | Loan Amount |
|---|---|---|---|
| Previous Owner | Perera Manoj S | $1,596,000 |
Source: Public Records
Tax History
| Year | Tax Paid | Tax Assessment Tax Assessment Total Assessment is a certain percentage of the fair market value that is determined by local assessors to be the total taxable value of land and additions on the property. | Land | Improvement |
|---|---|---|---|---|
| 2025 | $7,179 | $591,700 | $108,600 | $483,100 |
| 2024 | $7,141 | $120,600 | $120,600 | -- |
Source: Public Records
Map
Nearby Homes
- 40 Linda Ln
- 77 Linda Ln
- 3 Old Hickory Ln
- 404 Westgate Dr
- 302 Westgate Dr
- 4 Hemlock Dr
- 16 Moyse Place
- 7 Gentore Ct
- 5 Hackett Dr
- 133 Oakmont Ct Unit 133D
- 127 Oakmont Ct
- 16 Rolling Brook Dr
- 1691 Frank St
- 28 Hawthorn Dr
- 5 Old Raritan Rd
- 21 King St
- 1191 Cooper Rd
- 990 Inman Ave
- 2805 Cricket Cir
- 6 Tulip Ct
Your Personal Tour Guide
Ask me questions while you tour the home.