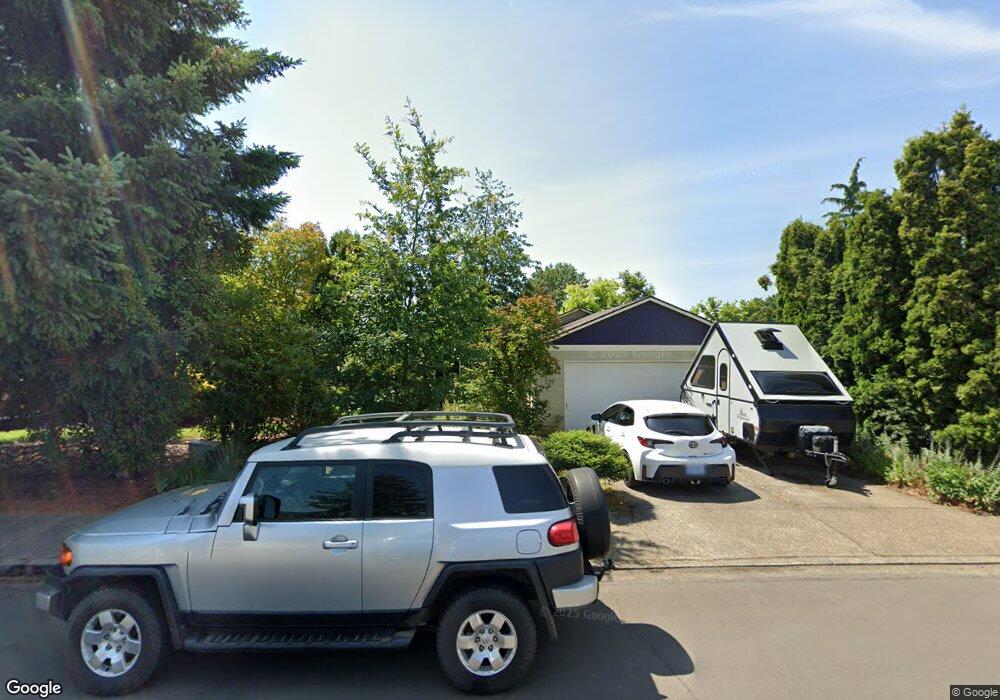
359 SW 11th St Dundee, OR 97115
Dundee NeighborhoodEstimated Value: $416,000 - $637,000
3
Beds
2
Baths
1,036
Sq Ft
$460/Sq Ft
Est. Value
About This Home
This home is located at 359 SW 11th St, Dundee, OR 97115 and is currently estimated at $476,638, approximately $460 per square foot. 359 SW 11th St is a home located in Yamhill County with nearby schools including Dundee Elementary School, Chehalem Valley Middle School, and Newberg Senior High School.
Ownership History
Date
Name
Owned For
Owner Type
Purchase Details
Closed on
Sep 17, 2020
Sold by
Thomas Brandy Ann and Clifton Brandy
Bought by
Thomas Andrew
Current Estimated Value
Home Financials for this Owner
Home Financials are based on the most recent Mortgage that was taken out on this home.
Original Mortgage
$265,771
Interest Rate
2.9%
Mortgage Type
New Conventional
Purchase Details
Closed on
Apr 29, 2008
Sold by
Dixon Bruce D and Dixon Grace E
Bought by
Thomas Andrew and Clifton Brandy
Home Financials for this Owner
Home Financials are based on the most recent Mortgage that was taken out on this home.
Original Mortgage
$206,755
Interest Rate
5.81%
Mortgage Type
FHA
Purchase Details
Closed on
Jun 28, 2007
Sold by
Claassen Ronald R and Claassen Maria E
Bought by
Dixon Bruce D and Dixon Grace E
Create a Home Valuation Report for This Property
The Home Valuation Report is an in-depth analysis detailing your home's value as well as a comparison with similar homes in the area
Home Values in the Area
Average Home Value in this Area
Purchase History
| Date | Buyer | Sale Price | Title Company |
|---|---|---|---|
| Thomas Andrew | -- | First American | |
| Thomas Andrew | $210,000 | First American Title | |
| Dixon Bruce D | $225,000 | First American Title |
Source: Public Records
Mortgage History
| Date | Status | Borrower | Loan Amount |
|---|---|---|---|
| Previous Owner | Thomas Andrew | $265,771 | |
| Previous Owner | Thomas Andrew | $206,755 |
Source: Public Records
Tax History Compared to Growth
Tax History
| Year | Tax Paid | Tax Assessment Tax Assessment Total Assessment is a certain percentage of the fair market value that is determined by local assessors to be the total taxable value of land and additions on the property. | Land | Improvement |
|---|---|---|---|---|
| 2025 | $3,029 | $214,547 | -- | -- |
| 2024 | $2,835 | $208,298 | -- | -- |
| 2023 | $2,755 | $202,231 | $0 | $0 |
| 2022 | $2,703 | $196,341 | $0 | $0 |
| 2021 | $2,649 | $190,622 | $0 | $0 |
| 2020 | $2,376 | $185,070 | $0 | $0 |
| 2019 | $2,376 | $179,680 | $0 | $0 |
| 2018 | $2,415 | $174,447 | $0 | $0 |
| 2017 | $2,632 | $169,366 | $0 | $0 |
| 2016 | $2,587 | $164,433 | $0 | $0 |
| 2015 | $2,496 | $159,645 | $0 | $0 |
| 2014 | $2,253 | $154,997 | $0 | $0 |
Source: Public Records
Map
Nearby Homes
- 906 SW Alder St Unit 4
- 625 SW 9th St Unit 32
- 1029 SW View Crest Dr
- 580 SW 9th St
- 759 SW Carmen Heights Dr
- 986 SW Tomahawk Place
- 980 SW 7th St
- 1277 SW 11th St
- 623 SW 5th St
- 1039 SW Upland Dr
- 409 SW Red Hills Dr
- 310 SW Birch St
- 287 SW Oliver Ct
- 166 NW Cherry St
- 19855 NE Trunk Rd
- 10623 NE Fox Farm Rd
- 10580 NE Fox Farm Rd
- 22305 NE Ilafern Ln
- 9989 NE Trillium Ln
- 20850 NE Big Fir Ln
- 361 SW 11th St
- 1144 SW James Ct
- 339 SW 11th St
- 1146 SW James Ct
- 1142 SW James Ct
- 375 SW 11th St
- 319 SW 11th St
- 227 SW 11th St
- 1175 SW Alder St
- 379 SW 11th St
- 1191 SW Alder St
- 1148 SW James Ct
- 225 SW 11th St
- 381 SW 11th St
- 1149 SW James Ct
- 340 SW 11th St
- 360 SW 11th St
- 1141 SW James Ct
- 221 SW 11th St
- 1143 SW James Ct