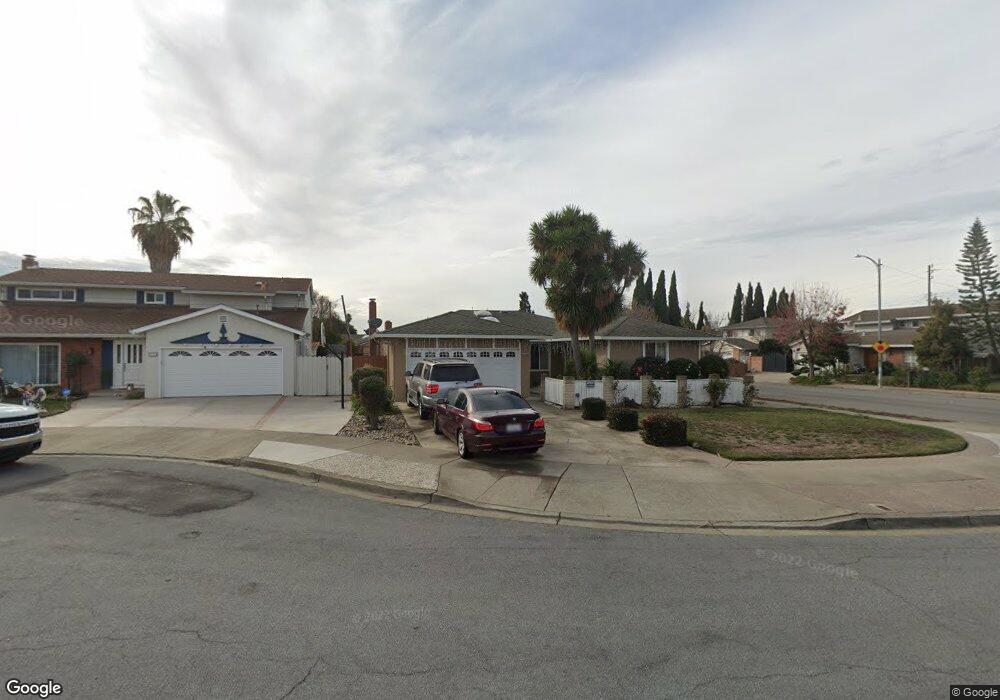
35901 Nicolet Ct Fremont, CA 94536
Estimated Value: $1,763,000 - $2,181,000
5
Beds
2
Baths
1,797
Sq Ft
$1,078/Sq Ft
Est. Value
About This Home
This home is located at 35901 Nicolet Ct, Fremont, CA 94536 and is currently estimated at $1,936,360, approximately $1,077 per square foot. 35901 Nicolet Ct is a home located in Alameda County with nearby schools including Oliveira Elementary School, Thornton Middle School, and American High School.
Ownership History
Date
Name
Owned For
Owner Type
Purchase Details
Closed on
Mar 14, 2013
Sold by
Dhaliwal Jabir Kaur and Dhaliwal Jasbir K
Bought by
Dhaliwal Jasbir K and The Jasbir K Dhaliwal Living T
Current Estimated Value
Purchase Details
Closed on
Nov 19, 2009
Sold by
Dhaliwal Gurtej Singh
Bought by
Dhaliwal Jasbir Kaur
Home Financials for this Owner
Home Financials are based on the most recent Mortgage that was taken out on this home.
Original Mortgage
$164,000
Interest Rate
4.99%
Mortgage Type
New Conventional
Purchase Details
Closed on
Oct 17, 1996
Sold by
Tabel Roger G and Tabel Pamela L
Bought by
Dhaliwal Gurtej Singh and Kaur Jasbir
Home Financials for this Owner
Home Financials are based on the most recent Mortgage that was taken out on this home.
Original Mortgage
$195,200
Interest Rate
8.3%
Create a Home Valuation Report for This Property
The Home Valuation Report is an in-depth analysis detailing your home's value as well as a comparison with similar homes in the area
Home Values in the Area
Average Home Value in this Area
Purchase History
| Date | Buyer | Sale Price | Title Company |
|---|---|---|---|
| Dhaliwal Jasbir K | -- | None Available | |
| Dhaliwal Jasbir Kaur | $83,000 | First American Title | |
| Dhaliwal Gurtej Singh | $244,000 | -- |
Source: Public Records
Mortgage History
| Date | Status | Borrower | Loan Amount |
|---|---|---|---|
| Closed | Dhaliwal Jasbir Kaur | $164,000 | |
| Previous Owner | Dhaliwal Gurtej Singh | $195,200 |
Source: Public Records
Tax History Compared to Growth
Tax History
| Year | Tax Paid | Tax Assessment Tax Assessment Total Assessment is a certain percentage of the fair market value that is determined by local assessors to be the total taxable value of land and additions on the property. | Land | Improvement |
|---|---|---|---|---|
| 2025 | $6,926 | $549,864 | $167,059 | $389,805 |
| 2024 | $6,926 | $538,948 | $163,784 | $382,164 |
| 2023 | $6,732 | $535,245 | $160,573 | $374,672 |
| 2022 | $6,633 | $517,752 | $157,425 | $367,327 |
| 2021 | $6,473 | $507,465 | $154,339 | $360,126 |
| 2020 | $6,454 | $509,193 | $152,758 | $356,435 |
| 2019 | $6,381 | $499,211 | $149,763 | $349,448 |
| 2018 | $6,254 | $489,425 | $146,827 | $342,598 |
| 2017 | $6,098 | $479,830 | $143,949 | $335,881 |
| 2016 | $5,987 | $470,424 | $141,127 | $329,297 |
| 2015 | $5,902 | $463,361 | $139,008 | $324,353 |
| 2014 | $5,796 | $454,288 | $136,286 | $318,002 |
Source: Public Records
Map
Nearby Homes
- 35942 Adobe Dr
- 35624 Mccarty Common
- 4626 Alhambra Dr
- 35856 Adobe Dr
- 35978 Magellan Dr
- 35377 Cabrillo Dr
- 35282 Cano Ct
- 35936 Magellan Dr
- 36304 Magellan Dr
- 4412 Elaiso Common
- 36347 Magellan Dr
- 35383 Purcell Place
- 35345 Cabral Dr
- 36139 San Pedro Dr
- 35415 Woodbridge Place
- 3751 Ruskin Place
- 36521 Cabrillo Dr
- 4543 Bartolo Terrace
- 4955 Swindon Place
- 4987 Winchester Place
- 35925 Nicolet Ct
- 4264 Nicolet Ave
- 4227 Nicolet Ave
- 35949 Nicolet Ct
- 4239 Nicolet Ave
- 4215 Nicolet Ave
- 35900 Nicolet Ct
- 35973 Nicolet Ct
- 35960 Wellington Place
- 35970 Wellington Place
- 35948 Nicolet Ct
- 4203 Nicolet Ave
- 35924 Nicolet Ct
- 35950 Wellington Place
- 35980 Wellington Place
- 4263 Nicolet Ave
- 35874 Toledo Ct
- 35892 Toledo Ct
- 35990 Wellington Place
- 4191 Nicolet Ave