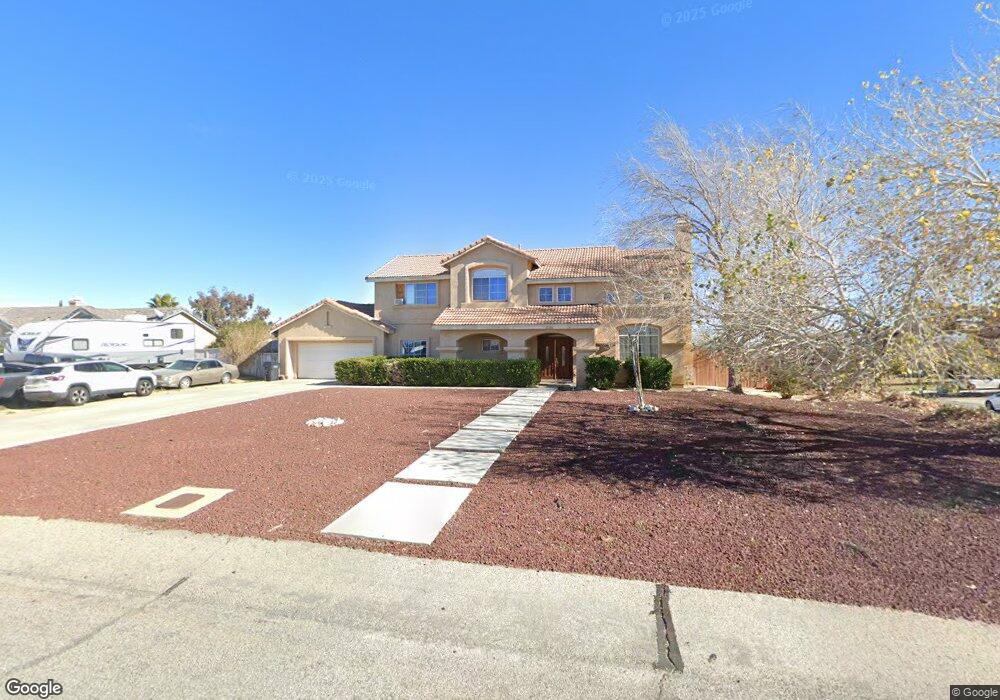
35906 55th St E Palmdale, CA 93552
Southeast Antelope Valley NeighborhoodEstimated Value: $582,000 - $739,000
4
Beds
3
Baths
2,157
Sq Ft
$294/Sq Ft
Est. Value
About This Home
This home is located at 35906 55th St E, Palmdale, CA 93552 and is currently estimated at $634,973, approximately $294 per square foot. 35906 55th St E is a home located in Los Angeles County with nearby schools including Buena Vista Elementary School, Desert Willow Fine Arts, Science, & Technology Magnet Academy, and Knight High School.
Ownership History
Date
Name
Owned For
Owner Type
Purchase Details
Closed on
Jan 26, 2016
Sold by
Brown Craig and Brown Rebeca Ana Moody
Bought by
Craig Brown and Craig Rebeca Ana
Current Estimated Value
Purchase Details
Closed on
Sep 27, 2012
Sold by
Brown Craig and Brown Rebeca Ann Moody
Bought by
Brown Craig and Brown Rebeca Ann Moody
Home Financials for this Owner
Home Financials are based on the most recent Mortgage that was taken out on this home.
Original Mortgage
$123,500
Outstanding Balance
$20,591
Interest Rate
3.63%
Mortgage Type
New Conventional
Estimated Equity
$614,382
Purchase Details
Closed on
Aug 16, 1995
Sold by
Beazer Homes California Inc
Bought by
Brown Craig and Brown Rebeca Ana Moody
Home Financials for this Owner
Home Financials are based on the most recent Mortgage that was taken out on this home.
Original Mortgage
$157,600
Interest Rate
7.5%
Create a Home Valuation Report for This Property
The Home Valuation Report is an in-depth analysis detailing your home's value as well as a comparison with similar homes in the area
Home Values in the Area
Average Home Value in this Area
Purchase History
| Date | Buyer | Sale Price | Title Company |
|---|---|---|---|
| Craig Brown | -- | None Available | |
| Brown Craig | -- | Accommodation | |
| Brown Craig | $175,500 | Investors Title Company |
Source: Public Records
Mortgage History
| Date | Status | Borrower | Loan Amount |
|---|---|---|---|
| Open | Brown Craig | $123,500 | |
| Closed | Brown Craig | $157,600 |
Source: Public Records
Tax History
| Year | Tax Paid | Tax Assessment Tax Assessment Total Assessment is a certain percentage of the fair market value that is determined by local assessors to be the total taxable value of land and additions on the property. | Land | Improvement |
|---|---|---|---|---|
| 2025 | $5,635 | $377,671 | $58,128 | $319,543 |
| 2024 | $5,635 | $370,267 | $56,989 | $313,278 |
| 2023 | $5,471 | $363,008 | $55,872 | $307,136 |
| 2022 | $5,259 | $355,891 | $54,777 | $301,114 |
| 2021 | $5,174 | $348,913 | $53,703 | $295,210 |
| 2019 | $4,986 | $338,565 | $52,111 | $286,454 |
| 2018 | $4,919 | $331,928 | $51,090 | $280,838 |
| 2016 | $4,552 | $319,041 | $49,107 | $269,934 |
| 2015 | $4,526 | $314,250 | $48,370 | $265,880 |
| 2014 | $4,170 | $281,000 | $43,300 | $237,700 |
Source: Public Records
Map
Nearby Homes
- 0 Vic Avenue T12 Vic 52nd Ste Unit 25007973
- 5849 E Avenue t8
- 5204 E Avenue t4
- 5040 E Avenue t8
- 50 E 50th St Unit Ste Vic
- 0 Pearblossom Hwy Unit IV25181913
- 0 Pearblossom Hwy Vic 62nd E Unit 24003486
- 6386 Pearblossom Hwy
- 35401 Cheseboro Rd
- 0 E Avenue T 8
- 6150 E Avenue T Unit 49
- 6150 E Avenue T Unit 36
- 5105 Spyglass Dr
- 4832 Summerbreeze Ct
- 0 47th St E Unit V7 25002798
- 5640 Eisenhower Way
- 36403 Chalone Dr
- 35433 Alida Ln
- 36807 Haven Ct
- 36324 43rd St E
- 35918 55th St E
- 5504 E Avenue t10
- 35907 55th St E
- 5370 E Avenue t10
- 35921 55th St E
- 35930 55th St E
- 5360 E Avenue t10
- 5522 E Avenue t10
- 5525 E Avenue t10 Unit E
- 5525 E Avenue t10
- 35933 55th St E
- 5514 E Avenue t10
- 5350 E Avenue t10
- 35942 55th St E
- 5526 E Avenue t10
- 5342 E Avenue t10
- 35945 55th St E
- 35950 55th St E
- 5330 E Avenue t10
- 35957 55th St E
Your Personal Tour Guide
Ask me questions while you tour the home.