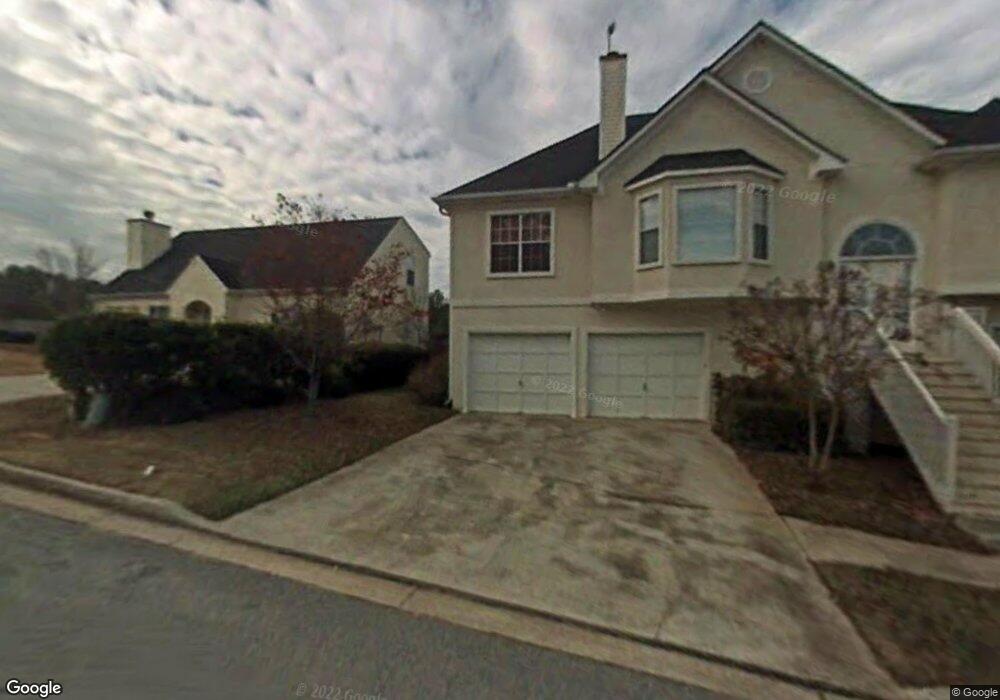
3593 Boulder Ridge Terrace Ellenwood, GA 30294
Southwest DeKalb NeighborhoodEstimated Value: $213,000 - $245,000
3
Beds
2
Baths
1,423
Sq Ft
$162/Sq Ft
Est. Value
About This Home
This home is located at 3593 Boulder Ridge Terrace, Ellenwood, GA 30294 and is currently estimated at $231,217, approximately $162 per square foot. 3593 Boulder Ridge Terrace is a home located in DeKalb County with nearby schools including Cedar Grove Elementary School, Cedar Grove Middle School, and Cedar Grove High School.
Ownership History
Date
Name
Owned For
Owner Type
Purchase Details
Closed on
Apr 8, 2021
Sold by
Resi Sfr Sub Llc
Bought by
Home Sfr Borrower Llc
Current Estimated Value
Purchase Details
Closed on
Feb 3, 2020
Sold by
Resicap Fund 1 Llc
Bought by
Resi Sfr Sub Llc and C/O Havenbrook Homes
Purchase Details
Closed on
Feb 15, 2019
Sold by
Tan Industries Llc
Bought by
Resicap Fund 1 Llc
Purchase Details
Closed on
Sep 4, 2003
Sold by
Hud
Bought by
Reed Cynthia A
Home Financials for this Owner
Home Financials are based on the most recent Mortgage that was taken out on this home.
Original Mortgage
$88,650
Interest Rate
6.28%
Mortgage Type
New Conventional
Purchase Details
Closed on
Nov 5, 2002
Sold by
Rbmg Inc
Bought by
Hud
Purchase Details
Closed on
Sep 28, 1999
Sold by
Forrest Homes Inc
Bought by
Matthews Robert A
Home Financials for this Owner
Home Financials are based on the most recent Mortgage that was taken out on this home.
Original Mortgage
$101,800
Interest Rate
7.85%
Mortgage Type
FHA
Create a Home Valuation Report for This Property
The Home Valuation Report is an in-depth analysis detailing your home's value as well as a comparison with similar homes in the area
Home Values in the Area
Average Home Value in this Area
Purchase History
| Date | Buyer | Sale Price | Title Company |
|---|---|---|---|
| Home Sfr Borrower Llc | -- | -- | |
| Resi Sfr Sub Llc | $133,350 | -- | |
| Resicap Fund 1 Llc | $106,500 | -- | |
| Tan Industries Llc | $91,000 | -- | |
| Reed Cynthia A | -- | -- | |
| Hud | -- | -- | |
| Rbmg Inc | $123,910 | -- | |
| Matthews Robert A | $101,900 | -- |
Source: Public Records
Mortgage History
| Date | Status | Borrower | Loan Amount |
|---|---|---|---|
| Previous Owner | Reed Cynthia A | $88,650 | |
| Previous Owner | Matthews Robert A | $101,800 |
Source: Public Records
Tax History Compared to Growth
Tax History
| Year | Tax Paid | Tax Assessment Tax Assessment Total Assessment is a certain percentage of the fair market value that is determined by local assessors to be the total taxable value of land and additions on the property. | Land | Improvement |
|---|---|---|---|---|
| 2025 | $4,262 | $87,120 | $13,939 | $73,181 |
| 2024 | $4,259 | $87,120 | $14,000 | $73,120 |
| 2023 | $4,259 | $82,920 | $14,000 | $68,920 |
| 2022 | $3,434 | $70,440 | $14,000 | $56,440 |
| 2021 | $2,685 | $53,360 | $7,880 | $45,480 |
| 2020 | $2,212 | $42,600 | $6,400 | $36,200 |
| 2019 | $2,553 | $50,360 | $8,000 | $42,360 |
| 2018 | $1,825 | $35,240 | $4,000 | $31,240 |
| 2017 | $1,914 | $34,600 | $4,000 | $30,600 |
| 2016 | $1,746 | $31,760 | $4,000 | $27,760 |
| 2014 | $1,605 | $27,880 | $4,000 | $23,880 |
Source: Public Records
Map
Nearby Homes
- 3444 Sugar Creek Cove Unit 16
- 4.2 + -Acres River Rd
- 2987 Bouldercrest Rd
- 2103 River Rd
- 1993 Whitehall Forest Ct SE
- 1997 Whitehall Forest Ct SE
- 3664 Satellite Terrace
- 1847 Whitehall Forest Ct SE
- 3871 Martin Dr
- 1974 Boulder Gate Dr
- 3287 River Ln SE
- 3541 Santa Leta Dr
- 2131 Brentwood Cove
- 3283 Sugar Creek Falls Ave SE
- 3275 Clifton Church Rd SE
- 3255 Sugar Creek Trace SE
- 3932 Misty Lake
- 3247 Sugar Creek Trace SE
- 3587 Boulder Ridge Terrace
- 3601 Boulder Ridge Terrace
- 3527 Boulder Cir
- 3537 Boulder Cir
- 3523 Boulder Cir
- 3555 Boulder Cir
- 3592 Boulder Ridge Terrace
- 3519 Boulder Cir
- 3596 Boulder Ridge Terrace
- 1944 Boulder Ridge Pkwy
- 3600 Boulder Ridge Terrace
- 3544 Boulder Cir
- 1938 Boulder Ridge Pkwy
- 3548 Boulder Cir
- 3515 Boulder Cir
- 3559 Boulder Cir
- 1952 Boulder Ridge Pkwy
- 3552 Boulder Cir
- 3536 Boulder Cir
- 3526 Boulder Cir