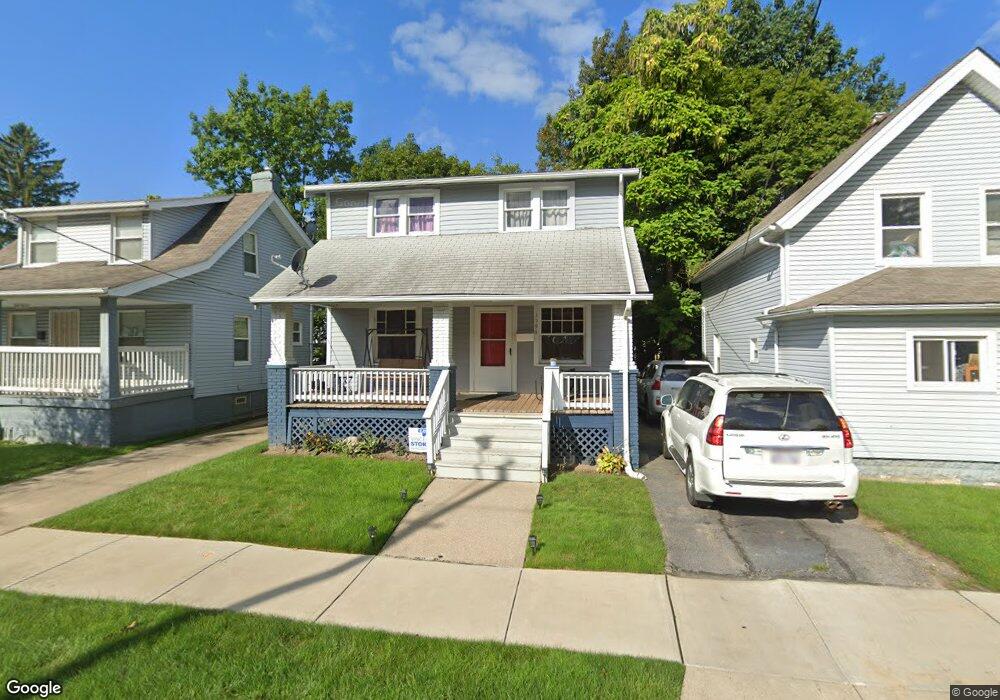
3594 E 104th St Cleveland, OH 44105
Union-Miles Park NeighborhoodEstimated Value: $62,136 - $81,000
3
Beds
2
Baths
1,152
Sq Ft
$64/Sq Ft
Est. Value
About This Home
This home is located at 3594 E 104th St, Cleveland, OH 44105 and is currently estimated at $74,034, approximately $64 per square foot. 3594 E 104th St is a home located in Cuyahoga County with nearby schools including Village Preparatory Academy: Woodland Hills Campus.
Ownership History
Date
Name
Owned For
Owner Type
Purchase Details
Closed on
Sep 17, 2018
Sold by
Makupson Darrell
Bought by
Andrews Cary
Current Estimated Value
Purchase Details
Closed on
Aug 30, 2018
Sold by
Andrews Cary C and Treasurer Of Cuyahoga County
Bought by
Makupson Darrell
Purchase Details
Closed on
Aug 23, 2010
Sold by
State Of Ohio
Bought by
Andrews Cary C
Purchase Details
Closed on
Apr 7, 2006
Sold by
Teer Carl M and Teer Carla M
Bought by
Teer Cornelius M
Purchase Details
Closed on
Sep 15, 2000
Sold by
Conger Daniel E
Bought by
Teer Carla M
Purchase Details
Closed on
Jun 29, 1990
Sold by
Teer Carl
Bought by
Teer Carl
Purchase Details
Closed on
Jul 21, 1977
Sold by
Secy H U D
Bought by
Teer Carl
Purchase Details
Closed on
Nov 4, 1976
Bought by
Secy H U D
Purchase Details
Closed on
Aug 3, 1976
Sold by
Young Shirley
Bought by
Federal Natl Mortgage Assoc
Purchase Details
Closed on
Jan 1, 1975
Bought by
Young Shirley
Create a Home Valuation Report for This Property
The Home Valuation Report is an in-depth analysis detailing your home's value as well as a comparison with similar homes in the area
Home Values in the Area
Average Home Value in this Area
Purchase History
| Date | Buyer | Sale Price | Title Company |
|---|---|---|---|
| Andrews Cary | $9,200 | None Available | |
| Makupson Darrell | $7,162 | None Available | |
| Andrews Cary C | -- | Public | |
| Teer Cornelius M | -- | None Available | |
| Teer Carla M | -- | -- | |
| Teer Carl | -- | -- | |
| Teer Carl | -- | -- | |
| Secy H U D | -- | -- | |
| Federal Natl Mortgage Assoc | $7,700 | -- | |
| Young Shirley | -- | -- |
Source: Public Records
Tax History
| Year | Tax Paid | Tax Assessment Tax Assessment Total Assessment is a certain percentage of the fair market value that is determined by local assessors to be the total taxable value of land and additions on the property. | Land | Improvement |
|---|---|---|---|---|
| 2024 | $608 | $9,275 | $2,625 | $6,650 |
| 2023 | $375 | $4,940 | $1,720 | $3,220 |
| 2022 | $373 | $4,935 | $1,715 | $3,220 |
| 2021 | $369 | $4,940 | $1,720 | $3,220 |
| 2020 | $366 | $4,240 | $1,470 | $2,770 |
| 2019 | $339 | $12,100 | $4,200 | $7,900 |
| 2018 | $346 | $4,240 | $1,470 | $2,770 |
| 2017 | $530 | $6,270 | $1,330 | $4,940 |
| 2016 | $526 | $6,270 | $1,330 | $4,940 |
| 2015 | $3,218 | $6,270 | $1,330 | $4,940 |
| 2014 | $3,218 | $7,360 | $1,580 | $5,780 |
Source: Public Records
Map
Nearby Homes
- 3591 E 104th St
- 3637 E 104th St
- 3531 E 104th St
- 3566 E 108th St
- 3542 E 108th St
- 3684 E 106th St
- 3486 E 105th St
- 9714 Orleans Ave
- 3552 E 110th St
- 3544 E 110th St
- 3540 E 110th St
- 9814 Dunlap Ave
- 3452 E 104th St
- 3525 E 110th St
- 10613 Sandusky Ave
- 3453 E 105th St
- 3582 E 112th St
- 9521 Union Ave
- 4350 East Blvd
- 0 Beacon Ave
- 3592 E 104th St
- 3600 E 104th St
- 3590 E 104th St
- 3604 E 104th St
- 3597 E 103rd St
- 3601 E 103rd St
- 3586 E 104th St
- 3608 E 104th St
- 3603 E 103rd St
- 3597 E 104th St
- 3591 E 103rd St
- 3593 E 104th St
- 3609 E 103rd St
- 3601 E 104th St
- 3584 E 104th St
- 3610 E 104th St
- 3587 E 103rd St
- 3605 E 104th St
- 3611 E 103rd St
- 3587 E 104th St
Your Personal Tour Guide
Ask me questions while you tour the home.