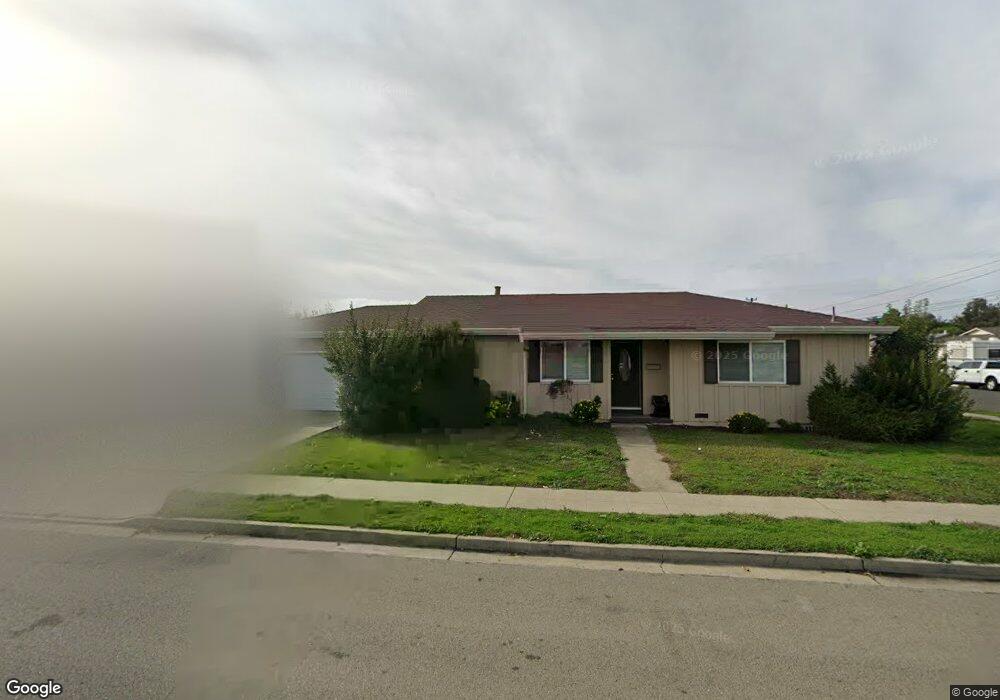
35941 Orleans Dr Newark, CA 94560
Estimated Value: $1,073,000 - $1,158,000
3
Beds
2
Baths
1,126
Sq Ft
$991/Sq Ft
Est. Value
About This Home
This home is located at 35941 Orleans Dr, Newark, CA 94560 and is currently estimated at $1,116,346, approximately $991 per square foot. 35941 Orleans Dr is a home located in Alameda County with nearby schools including Newark Junior High School, Newark Memorial High School, and Challenger School - Ardenwood.
Ownership History
Date
Name
Owned For
Owner Type
Purchase Details
Closed on
Feb 16, 2024
Sold by
Liu Shin-Ming and Chou Inling
Bought by
Liu-Chou Family Trust and Liu
Current Estimated Value
Purchase Details
Closed on
Feb 21, 2013
Sold by
Rodrigues Muriel Emslie and The Muriel Emslie Rodrigues Re
Bought by
Liu Shin Ming and Chou In Ling
Home Financials for this Owner
Home Financials are based on the most recent Mortgage that was taken out on this home.
Original Mortgage
$342,000
Interest Rate
3.4%
Mortgage Type
New Conventional
Purchase Details
Closed on
Aug 12, 2011
Sold by
Rodrigues Muriel Emslie
Bought by
Revoca Rodrigues Muriel Emslie and Revoca Muriel Emslie Rodrigues
Purchase Details
Closed on
Apr 21, 1994
Sold by
Rodrigues John and Rodrigues Muriel E
Bought by
Rodrigues John and Rodrigues Muriel E
Purchase Details
Closed on
Apr 20, 1994
Sold by
Rodrigues John and Rodrigues Muriel E
Bought by
Rodrigues John and Rodrigues Muriel E
Create a Home Valuation Report for This Property
The Home Valuation Report is an in-depth analysis detailing your home's value as well as a comparison with similar homes in the area
Home Values in the Area
Average Home Value in this Area
Purchase History
| Date | Buyer | Sale Price | Title Company |
|---|---|---|---|
| Liu-Chou Family Trust | -- | None Listed On Document | |
| Liu Shin Ming | $456,000 | Placer Title Company | |
| Revoca Rodrigues Muriel Emslie | -- | None Available | |
| Rodrigues Muriel Emslie | -- | None Available | |
| Rodrigues John | -- | Northwestern Title Company | |
| Rodrigues John | -- | Northwestern Title Company |
Source: Public Records
Mortgage History
| Date | Status | Borrower | Loan Amount |
|---|---|---|---|
| Previous Owner | Liu Shin Ming | $342,000 |
Source: Public Records
Tax History Compared to Growth
Tax History
| Year | Tax Paid | Tax Assessment Tax Assessment Total Assessment is a certain percentage of the fair market value that is determined by local assessors to be the total taxable value of land and additions on the property. | Land | Improvement |
|---|---|---|---|---|
| 2025 | $7,107 | $561,508 | $168,452 | $393,056 |
| 2024 | $7,107 | $550,501 | $165,150 | $385,351 |
| 2023 | $6,910 | $539,707 | $161,912 | $377,795 |
| 2022 | $6,817 | $529,128 | $158,738 | $370,390 |
| 2021 | $6,649 | $518,754 | $155,626 | $363,128 |
| 2020 | $6,543 | $513,437 | $154,031 | $359,406 |
| 2019 | $6,452 | $503,373 | $151,012 | $352,361 |
| 2018 | $6,355 | $493,505 | $148,051 | $345,454 |
| 2017 | $6,194 | $483,828 | $145,148 | $338,680 |
| 2016 | $6,129 | $474,344 | $142,303 | $332,041 |
| 2015 | $6,108 | $467,221 | $140,166 | $327,055 |
| 2014 | $5,942 | $458,070 | $137,421 | $320,649 |
Source: Public Records
Map
Nearby Homes
- 6831 Cabernet Ave
- 36184 Toulouse St
- 6875 Normandy Dr
- 6740 Normandy Dr
- 35421 Cleremont Dr
- 36146 Indian Wells Dr
- 36383 Colbert St
- 7574 Birkdale Dr
- 6784 Montcalm Ave
- 6354 Jarvis Ave
- 36466 Haley St
- 35914 Burning Tree Dr
- 36523 Cherry St
- 6220 Jarvis Ave
- 36535 Mulberry St
- 6025 Radcliffe Ave
- 36563 Beutke Dr
- 36109 Dalewood Dr
- 5879 Caleb Ct
- 6234 Zulmida Ave
- 6742 Cabernet Ave
- 35985 Orleans Dr
- 6784 Cabernet Ave
- 6751 Rochelle Ave
- 35956 Orleans Dr
- 35942 Orleans Dr
- 35907 Orleans Dr
- 35972 Orleans Dr
- 6741 Cabernet Ave
- 35926 Orleans Dr
- 6781 Rochelle Ave
- 6777 Cabernet Ave
- 6671 Rochelle Ave
- 35908 Orleans Dr
- 6811 Rochelle Ave
- 6791 Cabernet Ave
- 6551 Cedar Blvd
- 6563 Cedar Blvd
- 6826 Cabernet Ave
- 35891 Orleans Dr