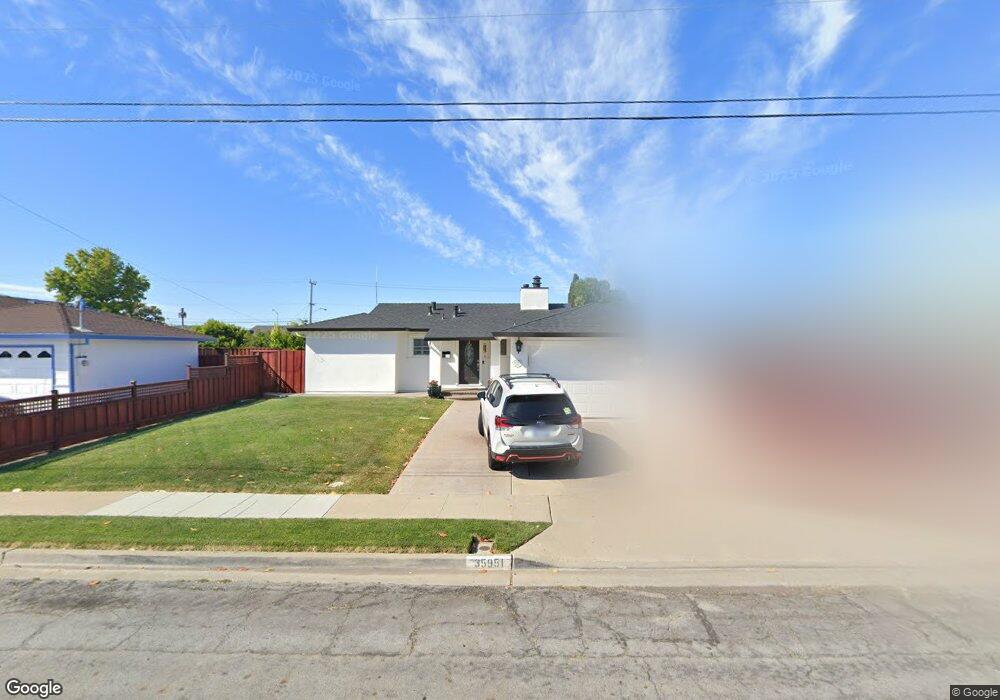
35951 Dalewood Dr Newark, CA 94560
Estimated Value: $1,034,000 - $1,239,000
3
Beds
2
Baths
1,136
Sq Ft
$993/Sq Ft
Est. Value
About This Home
This home is located at 35951 Dalewood Dr, Newark, CA 94560 and is currently estimated at $1,127,869, approximately $992 per square foot. 35951 Dalewood Dr is a home located in Alameda County with nearby schools including John F. Kennedy Elementary School, Newark Junior High School, and Newark Memorial High School.
Ownership History
Date
Name
Owned For
Owner Type
Purchase Details
Closed on
Nov 17, 1999
Sold by
Rubio Jose and Rubio Esperanza
Bought by
Aguilar Rafael and Aguilar Veronica
Current Estimated Value
Home Financials for this Owner
Home Financials are based on the most recent Mortgage that was taken out on this home.
Original Mortgage
$232,000
Outstanding Balance
$77,053
Interest Rate
8.9%
Mortgage Type
Stand Alone First
Estimated Equity
$1,050,816
Purchase Details
Closed on
Aug 4, 1999
Sold by
Whiteley Cary J and Whiteley Jocelyn G
Bought by
Rubio Jose and Rubio Esperanza
Home Financials for this Owner
Home Financials are based on the most recent Mortgage that was taken out on this home.
Original Mortgage
$100,000
Interest Rate
7.64%
Create a Home Valuation Report for This Property
The Home Valuation Report is an in-depth analysis detailing your home's value as well as a comparison with similar homes in the area
Home Values in the Area
Average Home Value in this Area
Purchase History
| Date | Buyer | Sale Price | Title Company |
|---|---|---|---|
| Aguilar Rafael | $290,000 | Old Republic Title Company | |
| Rubio Jose | $228,000 | Old Republic Title Company |
Source: Public Records
Mortgage History
| Date | Status | Borrower | Loan Amount |
|---|---|---|---|
| Open | Aguilar Rafael | $232,000 | |
| Previous Owner | Rubio Jose | $100,000 | |
| Closed | Aguilar Rafael | $58,000 |
Source: Public Records
Tax History
| Year | Tax Paid | Tax Assessment Tax Assessment Total Assessment is a certain percentage of the fair market value that is determined by local assessors to be the total taxable value of land and additions on the property. | Land | Improvement |
|---|---|---|---|---|
| 2025 | $5,716 | $438,697 | $133,709 | $311,988 |
| 2024 | $5,716 | $429,960 | $131,088 | $305,872 |
| 2023 | $5,551 | $428,393 | $128,518 | $299,875 |
| 2022 | $5,468 | $412,994 | $125,998 | $293,996 |
| 2021 | $5,333 | $404,761 | $123,528 | $288,233 |
| 2020 | $5,227 | $407,541 | $122,262 | $285,279 |
| 2019 | $5,154 | $399,552 | $119,865 | $279,687 |
| 2018 | $5,073 | $391,720 | $117,516 | $274,204 |
| 2017 | $4,943 | $384,040 | $115,212 | $268,828 |
| 2016 | $4,885 | $376,511 | $112,953 | $263,558 |
| 2015 | $4,867 | $370,857 | $111,257 | $259,600 |
| 2014 | $4,732 | $363,592 | $109,077 | $254,515 |
Source: Public Records
Map
Nearby Homes
- 35952 Rosewood Dr
- 36057 Dalewood Dr
- 5879 Caleb Ct
- 5585 Fernwood Dr
- 5874 Caleb Ct
- 36255 Casey Ct
- 6252 Bennington Dr
- 6048 Bellhaven Ave
- 36465 Hafner St
- 35415 Blackburn Dr
- 5298 Sussex Place
- 6449 Cedar Blvd
- 35050 Lido Blvd Unit B
- 5228 Falmouth Place
- 5311 Port Sailwood Dr
- 5912 Mayhews Landing Rd
- 6328 Zulmida Ave
- 35421 Cleremont Dr
- 6435 Normandy Dr
- 5136 Ramsgate Dr
- 35965 Dalewood Dr
- 35935 Dalewood Dr
- 35958 Newark Blvd
- 35976 Newark Blvd
- 35942 Newark Blvd
- 35977 Dalewood Dr
- 35923 Dalewood Dr
- 35944 Dalewood Dr
- 35994 Newark Blvd
- 35962 Dalewood Dr
- 35930 Dalewood Dr
- 35993 Dalewood Dr
- 35907 Dalewood Dr
- 35978 Dalewood Dr
- 36010 Newark Blvd
- 35908 Newark Blvd
- 35905 Rosewood Dr
- 35990 Dalewood Dr
- 36007 Dalewood Dr
- 35891 Dalewood Dr
Your Personal Tour Guide
Ask me questions while you tour the home.