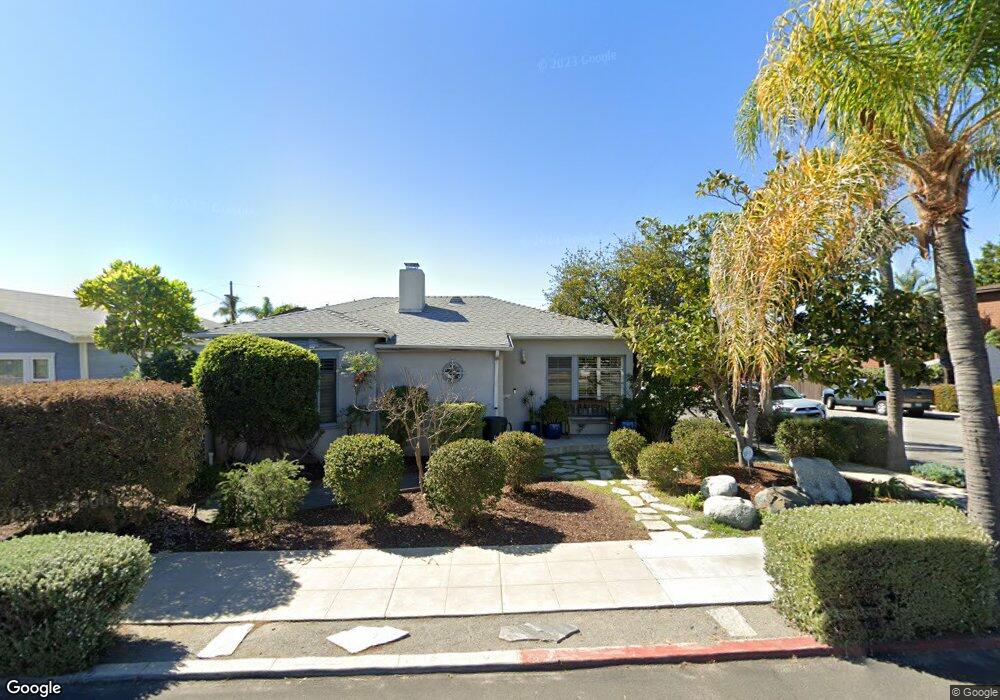
3596 Texas St San Diego, CA 92104
North Park NeighborhoodEstimated Value: $1,216,996 - $1,413,000
3
Beds
2
Baths
1,351
Sq Ft
$973/Sq Ft
Est. Value
About This Home
This home is located at 3596 Texas St, San Diego, CA 92104 and is currently estimated at $1,314,999, approximately $973 per square foot. 3596 Texas St is a home located in San Diego County with nearby schools including Jefferson Elementary, Roosevelt International Middle School, and Kindred Montessori.
Ownership History
Date
Name
Owned For
Owner Type
Purchase Details
Closed on
Jan 11, 2007
Sold by
Palomo Jeanne
Bought by
Palomo Jeanne M
Current Estimated Value
Purchase Details
Closed on
Jan 8, 2003
Sold by
Palomo Fabian
Bought by
Palomo Jeanne
Home Financials for this Owner
Home Financials are based on the most recent Mortgage that was taken out on this home.
Original Mortgage
$176,500
Interest Rate
5.39%
Purchase Details
Closed on
Dec 18, 2001
Sold by
Palomo Jeanne Marie
Bought by
Palomo Jeanne
Home Financials for this Owner
Home Financials are based on the most recent Mortgage that was taken out on this home.
Original Mortgage
$180,000
Interest Rate
6.66%
Mortgage Type
Purchase Money Mortgage
Purchase Details
Closed on
Jan 12, 1999
Sold by
Jeanne Borkowski
Bought by
Palomo Jeanne Marie
Purchase Details
Closed on
Aug 18, 1997
Sold by
Borkowski Carl F
Bought by
Borkowski Jeanne Marie
Purchase Details
Closed on
Dec 30, 1988
Purchase Details
Closed on
Apr 25, 1985
Create a Home Valuation Report for This Property
The Home Valuation Report is an in-depth analysis detailing your home's value as well as a comparison with similar homes in the area
Home Values in the Area
Average Home Value in this Area
Purchase History
| Date | Buyer | Sale Price | Title Company |
|---|---|---|---|
| Palomo Jeanne M | -- | None Available | |
| Palomo Jeanne | -- | Fidelity National Title Co | |
| Palomo Jeanne | -- | First American Title Ins Co | |
| Palomo Jeanne Marie | -- | -- | |
| Borkowski Jeanne Marie | -- | -- | |
| -- | $205,000 | -- | |
| -- | $121,100 | -- |
Source: Public Records
Mortgage History
| Date | Status | Borrower | Loan Amount |
|---|---|---|---|
| Closed | Palomo Jeanne | $176,500 | |
| Closed | Palomo Jeanne | $180,000 |
Source: Public Records
Tax History Compared to Growth
Tax History
| Year | Tax Paid | Tax Assessment Tax Assessment Total Assessment is a certain percentage of the fair market value that is determined by local assessors to be the total taxable value of land and additions on the property. | Land | Improvement |
|---|---|---|---|---|
| 2025 | $4,674 | $389,819 | $173,087 | $216,732 |
| 2024 | $4,674 | $382,177 | $169,694 | $212,483 |
| 2023 | $4,568 | $374,684 | $166,367 | $208,317 |
| 2022 | $4,444 | $367,338 | $163,105 | $204,233 |
| 2021 | $4,411 | $360,136 | $159,907 | $200,229 |
| 2020 | $4,357 | $356,444 | $158,268 | $198,176 |
| 2019 | $4,278 | $349,456 | $155,165 | $194,291 |
| 2018 | $3,999 | $342,605 | $152,123 | $190,482 |
| 2017 | $3,903 | $335,889 | $149,141 | $186,748 |
| 2016 | $3,838 | $329,304 | $146,217 | $183,087 |
| 2015 | $3,780 | $324,358 | $144,021 | $180,337 |
| 2014 | $3,720 | $318,005 | $141,200 | $176,805 |
Source: Public Records
Map
Nearby Homes
- 3537 Louisiana St
- 3533 Louisiana St
- 3536 Louisiana St
- 3660 Mississippi St
- 3736-38 Louisiana St
- 3693 Villa Terrace
- 2618 Landis St
- 3764 Villa Terrace
- 3805 Louisiana St
- 3776 Villa Terrace
- 3660 28th St
- 3776 Alabama St Unit 116
- 3776 Alabama St Unit 117
- 3405 Florida St Unit 410
- 3796 Alabama St Unit 118
- 3796 Alabama St Unit 304
- 3760 Florida St
- 3760 Florida St Unit 209
- 3420-30 Wilshire Terrace
- 1907 Robinson Ave Unit 309
- 3584 Texas St
- 2323 Dwight St
- 3576 Texas St
- 3604 Texas St
- 2315 Dwight St
- 3570 Texas St Unit 72
- 3612 Texas St
- 3595 Texas St
- 3583 Texas St Unit 85
- 3605 Texas St
- 3564 Texas St
- 3595 Louisiana St
- 3589 Louisiana St
- 3618-20 Texas St
- 3575 Texas St
- 3583-85 Texas St
- 3601 Louisiana St
- 3618 Texas St Unit 20
- 3581 Louisiana St
- 3565 Texas St