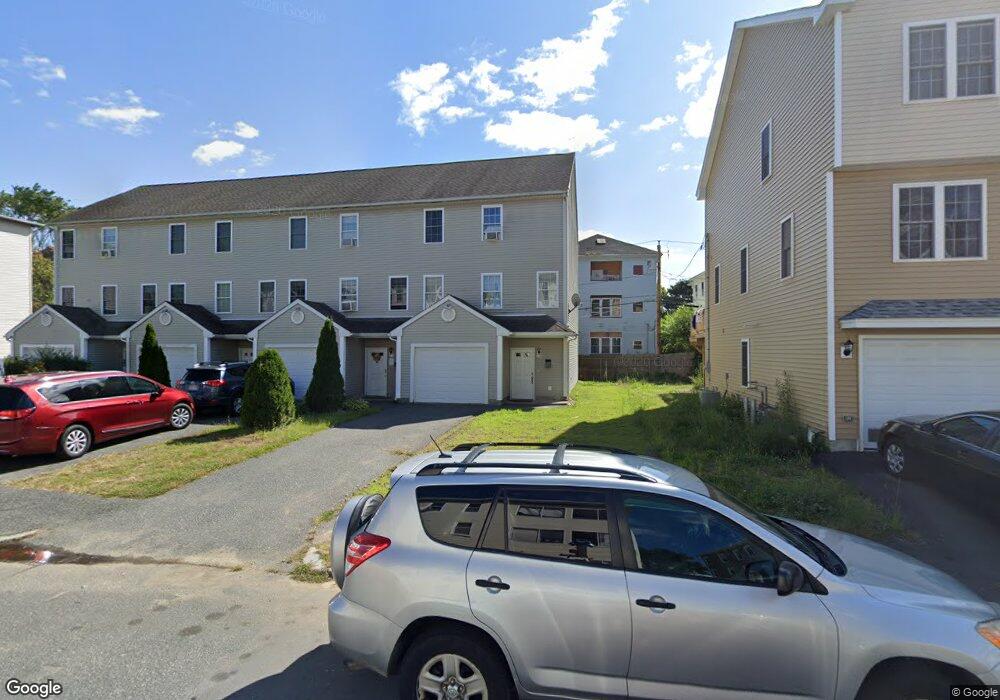
35B Sigel St Worcester, MA 01610
Green Island NeighborhoodEstimated Value: $297,000 - $412,000
3
Beds
2
Baths
1,302
Sq Ft
$278/Sq Ft
Est. Value
About This Home
This home is located at 35B Sigel St, Worcester, MA 01610 and is currently estimated at $361,890, approximately $277 per square foot. 35B Sigel St is a home located in Worcester County with nearby schools including Jacob Hiatt Magnet School, Chandler Elementary Community School, and Chandler Magnet.
Ownership History
Date
Name
Owned For
Owner Type
Purchase Details
Closed on
Sep 29, 2021
Sold by
Mugandani Babrah
Bought by
Mugandani Ruvimbo L and Mugandani Rudo L
Current Estimated Value
Purchase Details
Closed on
Jul 2, 2004
Sold by
Thuot Rene J
Bought by
Mugandani Babrah and Einriquez Louis A
Home Financials for this Owner
Home Financials are based on the most recent Mortgage that was taken out on this home.
Original Mortgage
$168,150
Interest Rate
6.3%
Mortgage Type
Purchase Money Mortgage
Create a Home Valuation Report for This Property
The Home Valuation Report is an in-depth analysis detailing your home's value as well as a comparison with similar homes in the area
Home Values in the Area
Average Home Value in this Area
Purchase History
| Date | Buyer | Sale Price | Title Company |
|---|---|---|---|
| Mugandani Ruvimbo L | -- | None Available | |
| Mugandani Babrah | $185,500 | -- |
Source: Public Records
Mortgage History
| Date | Status | Borrower | Loan Amount |
|---|---|---|---|
| Previous Owner | Mugandani Babrah | $168,150 |
Source: Public Records
Tax History
| Year | Tax Paid | Tax Assessment Tax Assessment Total Assessment is a certain percentage of the fair market value that is determined by local assessors to be the total taxable value of land and additions on the property. | Land | Improvement |
|---|---|---|---|---|
| 2025 | $3,902 | $295,800 | $39,600 | $256,200 |
| 2024 | $3,680 | $267,600 | $39,600 | $228,000 |
| 2023 | $3,482 | $242,800 | $31,800 | $211,000 |
| 2022 | $3,197 | $210,200 | $25,400 | $184,800 |
| 2021 | $3,124 | $191,900 | $20,400 | $171,500 |
| 2020 | $3,046 | $179,200 | $20,400 | $158,800 |
| 2019 | $2,966 | $164,800 | $20,100 | $144,700 |
| 2018 | $2,948 | $155,900 | $20,100 | $135,800 |
| 2017 | $2,760 | $143,600 | $20,100 | $123,500 |
| 2016 | $2,842 | $137,900 | $17,100 | $120,800 |
| 2015 | $2,768 | $137,900 | $17,100 | $120,800 |
| 2014 | $2,695 | $137,900 | $17,100 | $120,800 |
Source: Public Records
Map
Nearby Homes
- 13 Sigel St
- 195 Millbury St
- 69 Oread St
- 49 Richland St
- 5 S Ward St
- 13 Sterling St
- 607 Cambridge St Unit 4
- 82 Fox St
- 20 Washburn St
- 172 Perry Ave Unit 1A
- 172 Perry Ave Unit 2B
- 96 Vernon St
- 709 Main St
- 5 Ripley Place
- 1 Arlington St
- 52 Harrison St
- 64 Green St
- 2 Preston St
- 70 Southbridge St Unit 611
- 70 Southbridge St Unit 310
- 35A Sigel St
- 33 Sigel St Unit A
- 33B Sigel St
- 37 Sigel St
- 37A Sigel St
- 33A Sigel St
- 23 Endicott St
- 23 Endicott St Unit 2
- 41 Sigel St
- 41 Sigel St Unit 3
- 25 Endicott St
- 25 Endicott St Unit 2
- 21 Endicott St
- 31 Sigel St
- 27 Endicott St
- 19 Endicott St
- 19 Endicott St Unit 3
- 36 Sigel St
- 43 Sigel St
- 43 Sigel St Unit 1
Your Personal Tour Guide
Ask me questions while you tour the home.