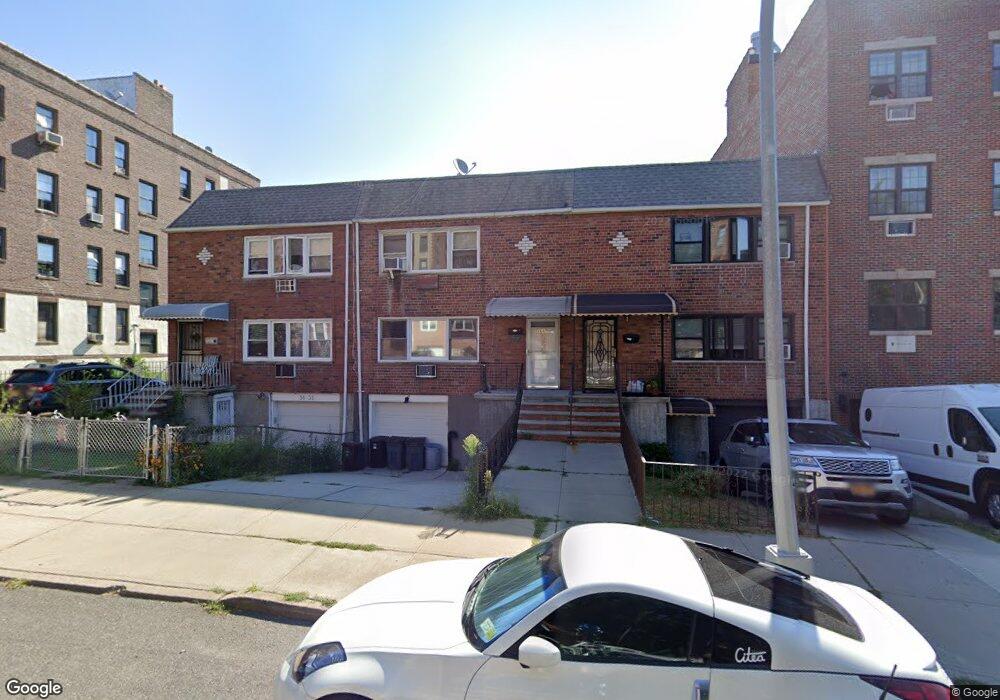
36-37 168th St Unit 1 Flushing, NY 11358
Flushing NeighborhoodEstimated Value: $1,452,323 - $1,830,000
2
Beds
1
Bath
2,722
Sq Ft
$617/Sq Ft
Est. Value
About This Home
This home is located at 36-37 168th St Unit 1, Flushing, NY 11358 and is currently estimated at $1,678,331, approximately $616 per square foot. 36-37 168th St Unit 1 is a home located in Queens County with nearby schools including P.S. 32 - State Street, I.S. 25 Adrien Block, and Francis Lewis High School.
Ownership History
Date
Name
Owned For
Owner Type
Purchase Details
Closed on
Apr 3, 2020
Sold by
Bernstein Gina
Bought by
Princess Enterprise Llc
Current Estimated Value
Home Financials for this Owner
Home Financials are based on the most recent Mortgage that was taken out on this home.
Original Mortgage
$510,000
Interest Rate
3.6%
Mortgage Type
Unknown
Purchase Details
Closed on
Feb 28, 2020
Sold by
Princess Enterprise Llc
Bought by
Bernstein Gina
Home Financials for this Owner
Home Financials are based on the most recent Mortgage that was taken out on this home.
Original Mortgage
$510,000
Interest Rate
3.6%
Mortgage Type
Unknown
Purchase Details
Closed on
Nov 2, 2015
Sold by
Bernstein Gina
Bought by
Princess Enterprise Llc
Purchase Details
Closed on
May 22, 1997
Sold by
Jones Julia A
Bought by
Bernstein Cazzola Gina M
Home Financials for this Owner
Home Financials are based on the most recent Mortgage that was taken out on this home.
Original Mortgage
$160,000
Interest Rate
7.86%
Create a Home Valuation Report for This Property
The Home Valuation Report is an in-depth analysis detailing your home's value as well as a comparison with similar homes in the area
Home Values in the Area
Average Home Value in this Area
Purchase History
| Date | Buyer | Sale Price | Title Company |
|---|---|---|---|
| Princess Enterprise Llc | -- | -- | |
| Bernstein Gina | -- | -- | |
| Princess Enterprise Llc | -- | -- | |
| Bernstein Cazzola Gina M | $230,000 | -- |
Source: Public Records
Mortgage History
| Date | Status | Borrower | Loan Amount |
|---|---|---|---|
| Previous Owner | Bernstein Gina | $510,000 | |
| Previous Owner | Bernstein Cazzola Gina M | $160,000 |
Source: Public Records
Tax History Compared to Growth
Tax History
| Year | Tax Paid | Tax Assessment Tax Assessment Total Assessment is a certain percentage of the fair market value that is determined by local assessors to be the total taxable value of land and additions on the property. | Land | Improvement |
|---|---|---|---|---|
| 2025 | $11,442 | $57,629 | $14,665 | $42,964 |
| 2024 | $11,442 | $56,970 | $14,562 | $42,408 |
| 2023 | $10,795 | $53,746 | $13,555 | $40,191 |
| 2022 | $10,729 | $67,800 | $20,520 | $47,280 |
| 2021 | $10,713 | $72,540 | $20,520 | $52,020 |
| 2020 | $10,165 | $72,540 | $20,520 | $52,020 |
| 2019 | $9,931 | $70,740 | $20,520 | $50,220 |
| 2018 | $9,130 | $44,788 | $15,726 | $29,062 |
| 2017 | $9,130 | $44,788 | $16,722 | $28,066 |
| 2016 | $8,480 | $44,788 | $16,722 | $28,066 |
| 2015 | $5,096 | $40,020 | $22,800 | $17,220 |
| 2014 | $5,096 | $39,563 | $19,151 | $20,412 |
Source: Public Records
Map
Nearby Homes
- 3641 169th St Unit 2F
- 167-10 Crocheron Ave Unit 6M
- 35-73 167th St
- 35-63 168th St
- 170-06 Crocheron Ave Unit 1F
- 170-20 Crocheron Ave Unit 206
- 3549 167th St
- 3639 171st St Unit 26
- 16502 Sanford Ave
- 35-05 167th St Unit 4
- 3541 164th St
- 43-04 169th St
- 4005 Utopia Pkwy
- 42-6 164th St
- 35-20 Utopia Pkwy
- 36-20 190th St
- 40-12 190th St
- 3369 164th St
- 4022 190th St
- 4343 166th St
- 3637 168th St
- 3639 168th St
- 36-35 168th St
- 3635 168th St
- 3641 168th St
- 36-41 168th St Unit 1
- 36-41 168th St
- 36-41 168th St Unit 1A
- 168-05 Depot Rd Unit BDNG
- 168-05 Depot Rd Unit 7
- 168-05 Depot Rd Unit 1B
- 168-05 Depot Rd Unit 3A
- 168-05 Depot Rd Unit 4B
- 3623 168th St
- 3640 169 St
- 3640 169 St Unit Bb
- 3634 169th St
- 3640 169th St
- 3640 169th St
- 3640 169th St Unit Bb